
Low-Stress High-Paying Jobs: What the O*NET Stress Data Shows
Low-stress high-paying jobs, measured: O*NET deadline, error and hours data for 724 occupations crossed with BLS pay, and which ones a mid-career switcher can reach.


Contents · 7 sections
The short answer, measured on federal survey data: training and development manager, management analyst, administrative services manager, project management specialist and data scientist all pay a six-figure median with daily deadline pressure far below finance or clinical roles, and none of them requires a graduate degree as standard. Most lists of low-stress, high-paying jobs never say how they measured stress, and the ones that name O*NET as a source publish no figure for the jobs they rank. So we pulled the numbers: how often people in each occupation face strict deadlines, how serious an uncorrectable mistake would be and how long their week runs, crossed with federal wage data for 724 occupations. Fourteen roles are worth a look, and each suits a different starting point:
- Training and development manager: managers who built teams, onboarding or internal programs, and teachers moving into corporate learning.
- Management analyst: anyone who can diagnose a process in an industry they know well.
- Administrative services manager: operations, facilities and office leads who already run the machinery behind a team.
- Project management specialist: people who have delivered complex work against deadlines, whatever the job title said.
- Data scientist: analysts, researchers and finance people willing to deepen statistics and programming.
- Software developer: the lowest pressure score of the 120 six-figure occupations, and the longest retraining on this list.
- Market research analyst: below the six-figure line, with some of the calmest deadline data in the set.
- Financial examiner: accountants, auditors and bankers who want regulation work at a steadier pace.
- Actuary: strong mathematicians prepared to sit a professional exam sequence.
- Statistician: quantitative researchers who hold or will earn a graduate degree.
- Database administrator: IT and analytics staff who already look after data systems.
- Materials engineer: engineering graduates, since the degree is the entry route.
- Geoscientist: science graduates with a geoscience or related degree.
- Postsecondary health specialties teacher: clinicians with a graduate degree who want to teach.
How do you measure whether a job is low stress?
Use what the people doing the job report about its conditions. O*NET, the occupation database the US Department of Labor maintains, surveys incumbent workers on dozens of "work context" items. Three of them come close to what people mean when they type "low stress" into a search bar:
- Time Pressure: "How often does this job require the worker to meet strict deadlines?" We use the share answering every day.
- Consequence of Error: "How serious would the result usually be if the worker made a mistake that was not easily correctable?" We use the share answering extremely serious.
- Duration of Typical Work Week: the share reporting more than 40 hours.
Averaging those three shares gives each occupation a single pressure score from 0 to 100. It is deliberately simple, so you can check any piece of it yourself. On the O*NET OnLine page for management analysts, for example, 19% of respondents meet strict deadlines every day, 62% face them weekly, and 33% work more than 40 hours.
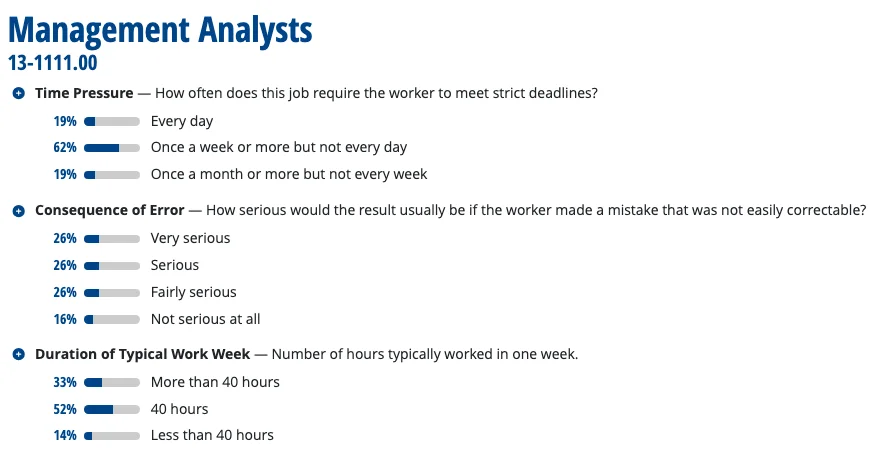
That checkability is what the ranking lists lack. Two of the top results for this search cite O*NET's stress tolerance rating or its work context data in their methodology, then print a salary for each job and no stress figure at all, so a reader has no way to see why a historian makes the cut.
The data: work context responses from the O*NET 31.0 database, limited to the three items above, matched by SOC code to national median wages from the BLS Occupational Employment and Wage Statistics (May 2025). 724 occupations had all three items and a published wage. Each figure is a share of incumbent respondents, typically around 22 per occupation, collected in different years (2012 to 2026 for the roles named in this article). Treat a gap of a few points between two occupations as noise. The pressure score is our own average of the three shares; O*NET does not publish one.
Does a higher salary mean more stress?
It does for hours, and it does not for deadlines, so the trade you can live with depends on what drains you. Split the 724 occupations into four equal bands by median pay and the length of the working week climbs steadily with every band:
| Answer | Share |
|---|---|
| Lowest-paid quarter of occupations | 22.7% |
| Second quarter | 38.4% |
| Third quarter | 46.3% |
| Best-paid quarter of occupations | 56.9% |
Daily deadlines behave differently. The share of workers who meet strict deadlines every day is highest in the lower-middle band, and it drops as pay rises:
| Answer | Share |
|---|---|
| Lowest-paid quarter of occupations | 39.1% |
| Second quarter | 41.2% |
| Third quarter | 30.2% |
| Best-paid quarter of occupations | 28.5% |
Two more correlations complete the picture. Median pay correlates at 0.32 with the share working long weeks and at 0.25 with the share saying a mistake would be extremely serious. Better-paid work tends to trade the constant small deadline for a longer week and bigger stakes per decision. Clinical work sits at the stakes end of that trade, and for pharmacists the first question is usually whether the pressure belongs to retail or to pharmacy itself, which career change for pharmacists works through. So the useful search is narrower than "low stress": you are looking for the six-figure roles that escaped the hours and the stakes, and those exist.
Which high-paying jobs have the lowest stress scores?
Of the 120 occupations with a national median of six figures, these 20 score lowest on the pressure score. The third column is the part the ranking lists skip: how people get in.
| Occupation | Pressure score | Usual route in |
|---|---|---|
| Software developers | 8 | Technical skills, often self-taught or retrained |
| Materials engineers | 15 | Engineering degree |
| Data scientists | 15 | Statistics and programming skills |
| Electronics engineers | 17 | Engineering degree |
| Actuaries | 17 | Professional exam sequence |
| Computer and information research scientists | 17 | Graduate degree (O*NET Job Zone Five) |
| Bioengineers and biomedical engineers | 17 | Engineering degree |
| Statisticians | 18 | Graduate degree (Job Zone Five) |
| Training and development managers | 19 | Experience managing people or learning programs |
| Management analysts | 19 | Industry or functional experience |
| Geoscientists | 20 | Science degree |
| Database administrators | 21 | Technical skills |
| Database architects | 21 | Technical skills |
| Materials scientists | 21 | Science degree |
| Administrative services managers | 21 | Operations or office management experience |
| Geographers | 22 | Science degree |
| Astronomers | 23 | Doctorate (Job Zone Five) |
| Project management specialists | 23 | Project delivery experience |
| Marine engineers and naval architects | 23 | Engineering degree |
| Health specialties teachers, postsecondary | 24 | Graduate degree (Job Zone Five) |
Read the third column and the list thins out fast. Eleven of the 20 hire on a specific engineering, physical-science or research degree, which is why astronomers and geographers keep appearing on lists aimed at people who cannot become either without starting over. For a mid-career reader, four rows stand out because they hire on experience you may already have: training and development managers, management analysts, administrative services managers and project management specialists. The technical rows (software, data, databases) are reachable too, at the cost of the longest retraining. The last row, health specialties teaching, is one of the calmer six-figure routes open to clinicians, and the guide on where physical therapists go after the clinic covers the teaching exit.
If you do not hold a bachelor's degree, this is the wrong shortlist, and the highest-paying careers without a degree start from a different constraint.
Which of these can a mid-career switcher reach without a new degree?
These are the roles where a decade of work counts as the qualification. O*NET rates all of them Job Zone Four or lower, which it describes as work where most roles "require a four-year bachelor's degree, but some do not", so a graduate degree is not the entry ticket. Current wage bands first:
| Role | 25th percentile | Median | 75th percentile | Who it takes |
|---|---|---|---|---|
| Training and development manager | $101,850 | $133,000 | $176,870 | Managers who built teams, onboarding or internal programs; teachers moving into corporate learning |
| Management analyst | $77,950 | $101,860 | $133,370 | Anyone who can diagnose a process in an industry they know well, internally or as a consultant |
| Administrative services manager | $86,460 | $114,130 | $157,420 | Operations, facilities and office leads who already run the machinery behind a team |
| Project management specialist | $78,440 | $102,320 | $133,100 | People who have delivered complex work against deadlines, whatever the job title said |
| Data scientist | $85,660 | $120,230 | $158,880 | Analysts, researchers and finance people willing to deepen statistics and programming |
| Software developer | $105,210 | $135,980 | $171,980 | The lowest pressure score of all 120, and the longest retraining on this list |
| Market research analyst | $58,350 | $78,760 | $108,310 | Below the six-figure line, and with some of the calmest deadline data in the set |
| Financial examiner | $70,660 | $94,160 | $129,600 | Accountants, auditors and bankers who want regulation work at a steadier pace |
Annual wages from the U.S. Bureau of Labor Statistics Occupational Employment and Wage Statistics program, May 2025 release. Half of workers in a role earn more than the median; the 25th to 75th percentile span shows how wide the role pays. To see where your current salary sits in your own occupation, use the free salary benchmark.
And the three stress measures behind them, straight from the O*NET survey:
| Role | Daily strict deadlines | Mistake would be extremely serious | Week over 40 hours |
|---|---|---|---|
| Training and development managers | 7% | 0% | 50% |
| Management analysts | 19% | 5% | 33% |
| Administrative services managers | 13% | 11% | 39% |
| Project management specialists | 27% | 9% | 33% |
| Data scientists | 4% | 4% | 38% |
| Software developers | 13% | 4% | 8% |
| Market research analysts | 5% | 0% | 32% |
| Financial examiners | 13% | 4% | 26% |
The table shows that each role carries its pressure in a different place. Training and development managers almost never face a daily deadline but half of them work long weeks. Project management specialists have the most frequent deadlines here, yet two thirds keep to a standard week. Software developers are the outlier on hours, with 90% of respondents on the O*NET page for the occupation reporting a 40-hour week. Pick the pressure you tolerate best, because none of these roles has zero of all three.
Why do some popular "low-stress" picks fail the test?
Because the reputation comes from one dimension and the data covers three. The chart sets the switcher shortlist against roles that career changers are often steered toward:
| Answer | Share |
|---|---|
| Data scientists | 4% |
| Training and development managers | 7.1% |
| Software developers | 12.5% |
| Administrative services managers | 12.7% |
| Management analysts | 19.1% |
| Project management specialists | 27.3% |
| Marketing managers | 36.3% |
| Technical writers | 47.9% |
| Web and digital interface designers | 52.7% |
| Financial managers | 61.1% |
Technical writing is the clearest case. It appears on low-stress lists because mistakes rarely carry extreme consequences, and on that item the data agrees. But on the O*NET page for technical writers, 48% say they meet strict deadlines every day and 46% work more than 40 hours. That survey dates from 2012, the oldest here, so weigh it accordingly, but nothing in it describes a calm job. Web and digital interface designers show the same split: a week of 40 hours or less for 91% and daily deadlines for 53%. Marketing managers carry the heaviest load of the group, with 51% saying a mistake would be extremely serious and 84% working beyond 40 hours.
One more caution applies to every number in this article. An occupation's figures describe its typical respondent, and employers vary widely. A management analyst inside a regional hospital and one billing hours at a consultancy share a title and little else. Use the data to choose where to look, then verify the specific employer (the last section shows how). Physical strain is also missing from the three measures, and for some clinicians it is the main cost: the dental hygienist guide covers the pain data behind many moves away from the chair.
Is a low-stress job the same as a job you will enjoy?
Removing pressure takes away a cost, and it adds nothing on its own, so calm is rarely the whole goal. In the Career Changer Index, about two in three quiz takers with four or more years of experience say they want meaning and income equally, and only a small minority put income first.
| Answer | Share |
|---|---|
| Meaning and income, both equally | 64.7% |
| Financial security first | 17.6% |
| Would sacrifice income for the right work | 13% |
| Income now, passion later | 4.6% |

That combination matters for this list, because stress is partly a property of the fit. A weekly deadline on work that absorbs you feels different from the same deadline on work you have to force yourself through, and the same O*NET score can mean opposite experiences for two people. It is also why a role that looks calm on paper can still wear you out, which is the ground covered by the guide on recovering from burnout while staying in your job. If the draining part turns out to be the work itself, a calmer version of the same work will not fix it.
The quiz approaches that from the other end. For someone changing careers, one of its questions asks which moments in your current or last job made you forget to check the clock, and the answers feed the archetype that decides which careers it matches. A Freedom Seeker, the career switcher who puts lifestyle first, should read the hours column before the pay column. An Ambitious Pivoter puts income first, so a long week may be an acceptable price for a higher ceiling, and the table above shows where that price is lowest. If what you are after is enjoyment rather than calm, fun careers that pay well sorts well-paid roles by the kind of fun they offer.
How do you check a role's stress level before you switch?
Look up the role, then test the employer. The occupation data narrows the field and a handful of conversations tells you about the specific job.
- Read the three items on O*NET OnLine. Search the occupation, open its details page, and scroll to Work Context. Time Pressure, Consequence of Error and Duration of Typical Work Week sit a few lines apart. It takes five minutes and it beats any list, including this one.
- Ask the same three questions in informational interviews. "When did you last have a hard deadline, and how often does one come round?" "What happens here when someone gets a number wrong?" "What time did you log off last Thursday?" Concrete questions get concrete answers, where "is it stressful?" gets a polite shrug.
- Check the pay side separately. A lower-pressure role that pays below your current salary is a trade you should price before you make it. The BLS bands above are national figures, so compare against your own position with the salary benchmark tool.
- Run a small test before a full move. A contract project, a secondment into your company's learning team or a stretch assignment with the PMO shows you the pressure from the inside at almost no cost. The wider sequence for changing careers mid-career, from first test to first offer, is laid out in the main guide.
The step most people skip is the one before all of these: knowing which kind of pressure you handle well. The career change quiz asks 26 branching questions about the work that absorbs you and the priorities you bring to the move, and it places you in one of 20 archetypes with matched careers and first steps. The median taker finishes in about seven minutes. Bring the result to the tables above and the shortlist gets much shorter, and much more yours.
Frequently Asked Questions
Ready to find your passion career?
The free under-10-minute quiz maps your childhood patterns and flow triggers to one of 20 archetypes, then gives you matched careers and a 7-day first-step plan.
Take the Free Career QuizRelated Articles
Trusted by 12,200+ career-quiz takers across 165+ countries · Methods covered in