
Burnout Statistics 2026
Published burnout figures disagree by tens of percentage points. That is not because some of them are lying. It is because they measure different things, and almost none of the articles quoting them say which.
This page gives the official definition, one survey with its method on the table, four checks to run before quoting any burnout number, and our own first-party data on workplace disengagement, which is a related and distinctly different thing.
Third-party figures are cited to their publishers. First-party figures state their base, are free to cite under CC BY 4.0, and reproduce from the published dataset.
The numbers worth carrying
Each line names its source and its base, written to be quoted as it stands.
- 01Occupational not medical. The WHO classifies burn-out in ICD-11 as an occupational phenomenon resulting from unmanaged chronic workplace stress, with three dimensions: exhaustion, cynicism, and reduced efficacy.
- 0261% of 2,000 nationally representative US workers were languishing rather than flourishing (University of Illinois Gies College of Business, February 2026).
- 0338% vs 29% report feeling burned out very frequently, languishing against flourishing employees. Frequent burnout is not confined to the unhappy (same survey).
- 0411.6% of 3,656 career-quiz respondents name being stuck or bored as their core struggle. This is a disengagement measure among career questioners, not a burnout prevalence estimate.
- 0526.2% is that share among people already paid well and seeking change, against 6.0% of students. Disengagement tracks with pay and seniority in this sample (n = 714 and 1,573).
- 0622.6% is that share among respondents with eight or more years of experience, against 5.3% of those with none (n = 962 and 1,713).
What burnout officially is
The World Health Organization classifies burn-out in ICD-11 as an occupational phenomenon rather than a medical condition. It is defined as resulting from chronic workplace stress that has not been successfully managed, and the WHO is explicit that the term refers to the occupational context and should not be applied to experiences in other areas of life.
The operational model behind it comes from Christina Maslach and Michael Leiter, whose 2016 World Psychiatry review consolidates four decades of research. It has three dimensions: exhaustion, mental distance or cynicism toward the job, and reduced professional efficacy.
Burnout in the technical sense requires all three dimensions to be assessed. A single question asking whether someone feels burned out captures a self-label, which is a legitimate thing to measure and a different thing to measure.
One survey with its method on the table
The Workplace Well-Being Report 2026 from the Center for Professional Responsibility in Business and Society at the University of Illinois Gies College of Business, published February 4, 2026, surveyed 2,000 nationally representative US workers. It found 61% languishing and 39% flourishing, and it replicated its own 2025 findings rather than reporting a dramatic swing.
The detail worth quoting is inside that split. Among languishing employees, 38% report feeling burned out very frequently. Among flourishing employees, the figure is 29%. Nearly three in ten people who are otherwise doing well at work still report frequent burnout.
That single comparison does more to explain the disagreement between burnout statistics than any headline rate. Frequent burnout is not confined to the unhappy, so where a survey draws its line decides its answer.
Four things to check before quoting a burnout number
The four questions below account for most of the spread between published figures. A number that cannot answer all four is not a number, it is a headline.
| Check | The question | Why it changes the number |
|---|---|---|
| Which construct | All three Maslach dimensions, or a single self-label question? | These are different instruments measuring different things. They are not interchangeable and routinely differ by double digits. |
| Which threshold | Ever experienced, currently experiencing, or experiencing very frequently? | Each step down the intensity ladder roughly changes the headline. Most circulated figures do not state which rung they sit on. |
| Which population | Nationally representative, one industry, one employer's clients, or a self-selected online panel? | Vendor surveys of their own customers are common in this topic and are not general-population estimates. |
| Who benefits | Who commissioned it, and do they sell a remedy? | A large share of circulating burnout figures come from companies selling wellbeing products. That does not make them wrong, but it belongs in the sentence. |
Compiled by MyPassion.AI from the WHO ICD-11 classification and the Maslach and Leiter construct.
If a figure cannot survive those four questions, the honest move is to cut it rather than attribute it vaguely. We apply the same rule here: several widely circulated burnout percentages were left off this page because we could not verify them on the original publisher's site.
What we can add, and what we cannot
The MyPassion.AI career quiz asks people to name their core career struggle from five fixed options. One reads "I'm stuck or bored in what I do now", chosen by 11.6% of 3,656 respondents. That is a disengagement measure among people questioning their career.
This is not a burnout statistic
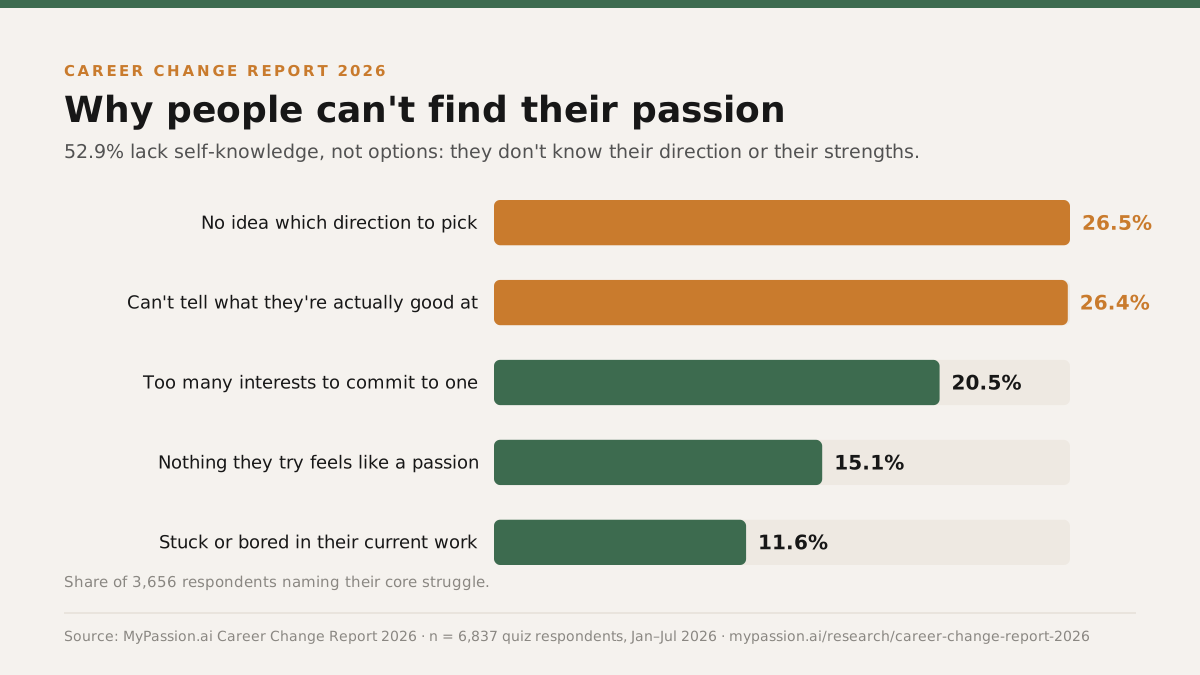
What our data can do, and what no external burnout survey can do with the same dataset, is cut that one measure five different ways. Every cell below is the same question, asked of a different subgroup, with its own base printed. This is the table to quote from if you want to say something specific about who disengages.
| Cut | Group | Share naming stuck or bored | Base n |
|---|---|---|---|
| Life situation | Student or graduate, no clear direction | 6% | 1,573 |
| Life situation | In a well-paying career, seeking change | 26.2% | 714 |
| Life situation | Too many interests, can't pick one | 6.1% | 690 |
| Life situation | Stuck or unemployed, going in circles | 14.6% | 679 |
| Years of experience | No experience yet | 5.3% | 1,713 |
| Years of experience | 1-3 years | 12.5% | 440 |
| Years of experience | 4-7 years | 12.8% | 391 |
| Years of experience | 8+ years | 22.6% | 962 |
| Years of experience | Returning after a career break | 7.7% | 143 |
| Education level | High school | 6.4% | 1,553 |
| Education level | Vocational or certifications | 12.7% | 306 |
| Education level | Self-taught or bootcamp | 6.8% | 146 |
| Education level | Bachelor's degree | 14.9% | 1,078 |
| Education level | Master's degree or higher | 20.1% | 568 |
| Work style | Improving what already exists | 11.6% | 1,092 |
| Work style | Connecting ideas or people | 11.8% | 1,051 |
| Work style | Starting new projects | 11.5% | 956 |
| Work style | Mastering one subject | 11.4% | 543 |
| Flow trigger | Learning or going deep on a topic | 13.1% | 696 |
| Flow trigger | Creating: writing, design, music, craft | 13.5% | 520 |
| Flow trigger | Being with people | 11% | 508 |
| Flow trigger | Solving hard technical problems | 11.2% | 366 |
| Flow trigger | Moving: sport, outdoors, hands-on | 11% | 236 |
Source: MyPassion.ai Career Change Report 2026 (n = 3,656 respondents), dataset frozen 28 July 2026
Disengagement tracks with pay and seniority
The two cuts that separate the sample most sharply are life situation and experience, and they point the same way. Among people already paid well and seeking change, 26.2% name being stuck or bored. Among students it is 6.0% and among the multi-interest group 6.1%. Among people with eight or more years of experience it is 22.6%, against 5.3% of those with none.
| No idea which direction to pick | Can't tell what they're good at | Too many interests to commit to one | Nothing they try feels like a passion | Stuck or bored in current work | Base n | |
|---|---|---|---|---|---|---|
| Student or graduate, no clear direction | 30% | 29.5% | 18.2% | 16.2% | 6% | 1,573 |
| In a well-paying career, seeking change | 21.8% | 21% | 15% | 16% | 26.2% | 714 |
| Too many interests, can't pick one | 21.7% | 23.2% | 39% | 10% | 6.1% | 690 |
| Stuck or unemployed, going in circles | 28% | 28.1% | 12.5% | 16.8% | 14.6% | 679 |
Source: MyPassion.ai Career Change Report 2026 (n = 3,656 respondents), dataset frozen 28 July 2026
| No idea which direction to pick | Can't tell what they're good at | Too many interests to commit to one | Nothing they try feels like a passion | Stuck or bored in current work | Base n | |
|---|---|---|---|---|---|---|
| No experience yet | 29.7% | 29.2% | 22.4% | 13.5% | 5.3% | 1,713 |
| 1-3 years | 25% | 27.7% | 19.1% | 15.7% | 12.5% | 440 |
| 4-7 years | 23.5% | 24.8% | 22.3% | 16.6% | 12.8% | 391 |
| 8+ years | 22.3% | 21.2% | 18% | 15.9% | 22.6% | 962 |
| Returning after a career break | 29.4% | 28% | 14% | 21% | 7.7% | 143 |
Source: MyPassion.ai Career Change Report 2026 (n = 3,649 respondents), dataset frozen 28 July 2026
Whatever this measure is picking up, it is not hardship. The groups reporting the most disengagement are the ones with the most secure positions, and the group in the hardest circumstances, people returning after a career break, reports it at 7.7%. That is the opposite of what a burnout-as-overwork story predicts, and it is the clearest evidence on this page that boredom and burnout are separate phenomena.
Boredom is not burnout
Burnout is a stress response. Its defining feature is exhaustion, arising from demands that exceeded what a person could sustain. Boredom is an engagement failure. It can occur with no exhaustion at all, in a job with entirely reasonable demands, and it frequently does: our highest disengagement rates sit in the best-paid, longest-tenured group.
The two can coexist, and the remedies point in opposite directions. Burnout usually calls for reducing load. Boredom usually calls for increasing difficulty. Prescribing rest to someone who is bored makes the problem worse, which is one reason a single wellbeing number is a poor guide to what any individual should do next.
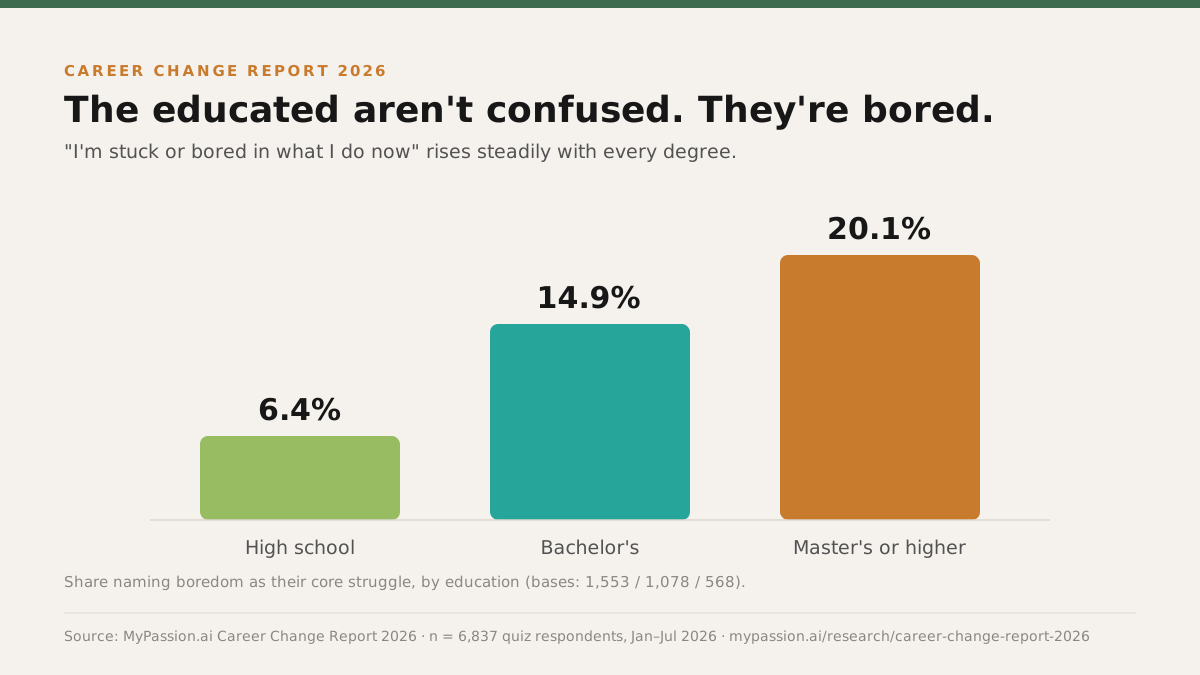
The education gradient points the same way. Disengagement rises with every level of formal education, from 6.4% at high school to 20.1% at master's level. The full treatment, including what happens when career stage is held constant, is in The Education Paradox.
What each figure here can and cannot claim
Third-party figures on this page belong to the organisations that produced them and are linked to their original publications. We do not restate, adjust or recompute them. Where we could not verify a widely circulated figure on the original publisher's site, it was cut rather than attributed vaguely.
Every first-party figure comes from the frozen Career Change Report 2026 dataset: 6,837 anonymized responses collected between January 29 and July 28, 2026. The quiz contains no burnout instrument. It asks which core career struggle a respondent selects, and one option refers to being stuck or bored. Nothing derived from it is a burnout measurement.
This is a self-selected sample of people actively questioning their career, not a representative population panel, so it describes the anatomy of disengagement rather than its prevalence. Bases vary by field and are printed with every figure. Any cross-tab row under 100 respondents is suppressed. The full sampling frame, exclusion rules and limitations are on the the sampling frame and its limits, and the dataset is available as aggregate tables and custom cuts on request: email the research team.
How to cite this page
Everything here is free to reuse under CC BY 4.0 with a link back. Charts, tables and the response-level dataset included.
MyPassion.AI (2026). Burnout Statistics 2026. Career Change Report 2026. Retrieved from https://mypassion.ai/research/burnout-statistics
More from the Career Change Report 2026
Every page below cuts the same 6,837 responses a different way. Same dataset, same methodology, different question.
Also in this series: the Career Change Report 2026, career change statistics 2026, job hopping statistics 2026. The sampling frame, exclusions and suppression rules are in the research methodology, and the full index sits on the research hub. On the blog, beat burnout without quitting is the version written for the person in it, not about them.
Questions about burnout statistics
Rest fixes exhaustion. It does nothing for a job that stopped asking anything of you.
Take the free career quiz
Research and analysis by Marco Kohns, founder of MyPassion.AI.
Published growth researcher (Journal of Business Research, Q1), MSc NOVA IMS Lisbon, and lecturer on AI for business at Católica Lisbon School of Business and Economics. Previously a growth product manager at a Silicon Valley scale-up operating in 100+ countries.
Disclosure: MyPassion.AI operates the career quiz that produced this data and sells a paid career report. Every figure states its base, the method is published in full, and we run custom cuts of the aggregate data for journalists and researchers on request.