
The Career Change Report 2026
What 6,837 people told us about being lost in their careers. Between January 29 and July 28, 2026, people from 156 countries answered the MyPassion.ai career quiz while looking for direction. This report aggregates their anonymized answers: who is questioning their career, why, and where the pattern breaks with common advice.
Every chart and table is free to reuse under CC BY 4.0 with a link to this page. Every figure is computed from one frozen response-level dataset, which we share with journalists and researchers on request.
Twelve numbers that describe career doubt in 2026
Each line below is a complete claim with its own base, written to be quoted as it stands. Sections further down break every one of them apart.
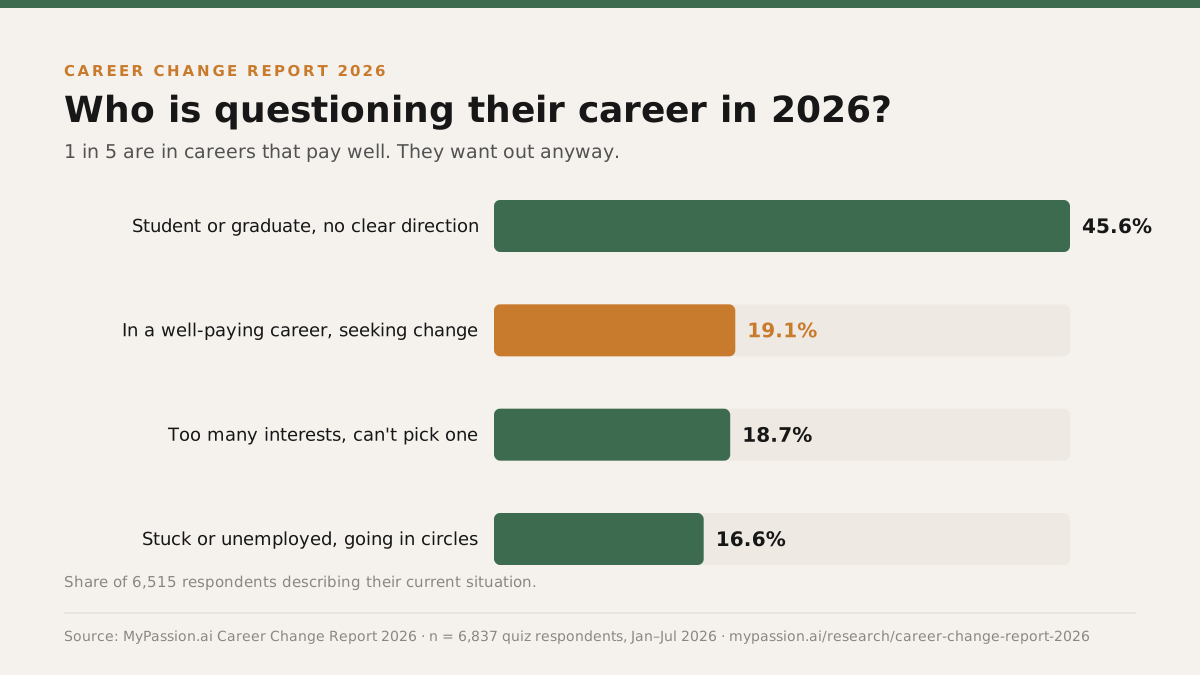
- 0119.1% of people questioning their career are in jobs that already pay well and want out anyway (n = 6,515).
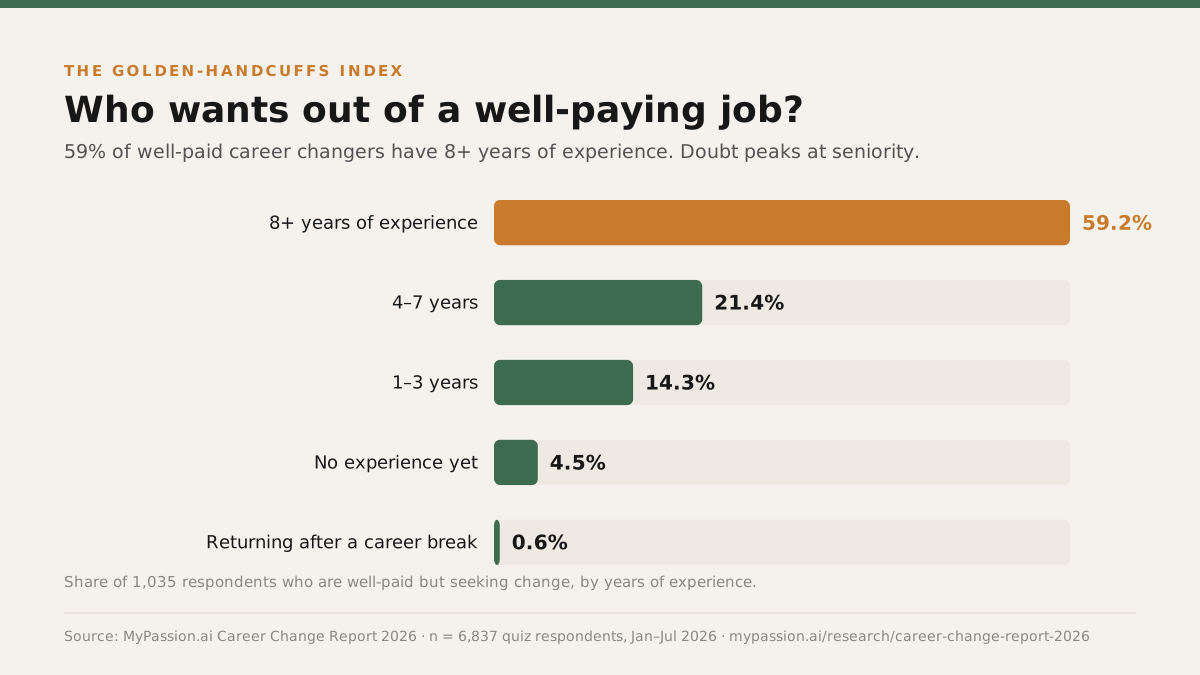
- 0259.2% of those well-paid leavers have 8 or more years of experience. Career doubt peaks at seniority, not at entry level (n = 1,035).
- 0326.2% of the well-paid group name boredom as their core struggle, against 6.0% of students and 6.1% of the multi-interest group (n = 714).
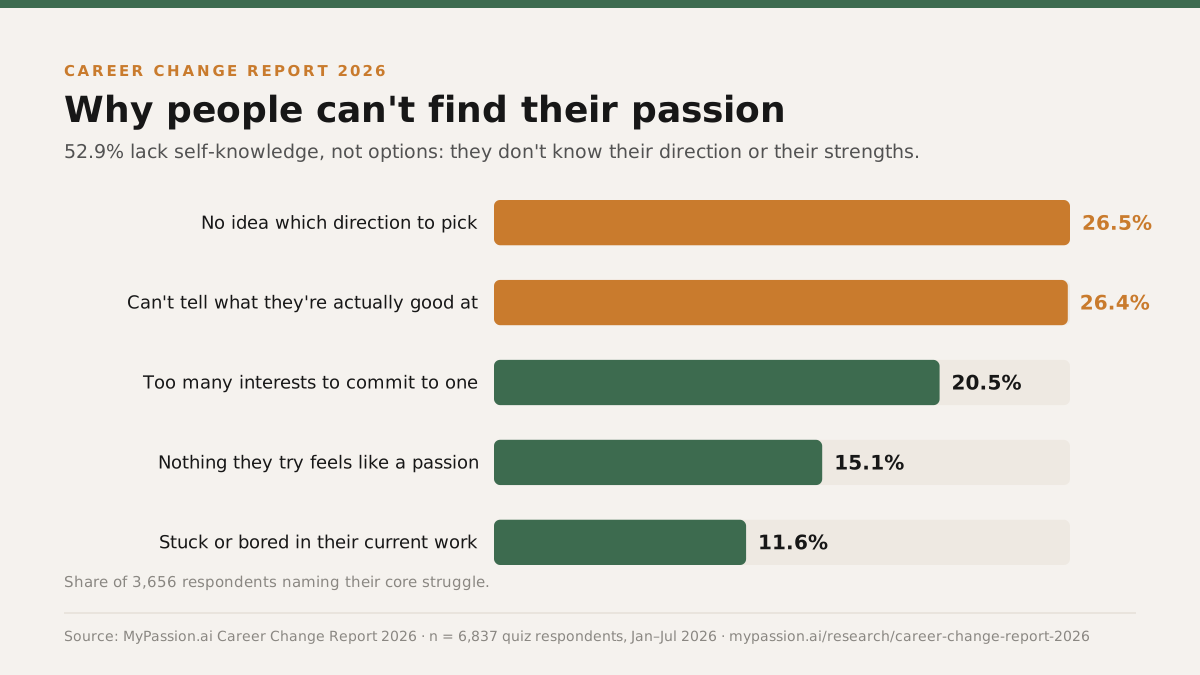
- 0452.9% name a self-knowledge problem as their core struggle: no idea which direction to pick, or no idea what they are good at (n = 3,656).
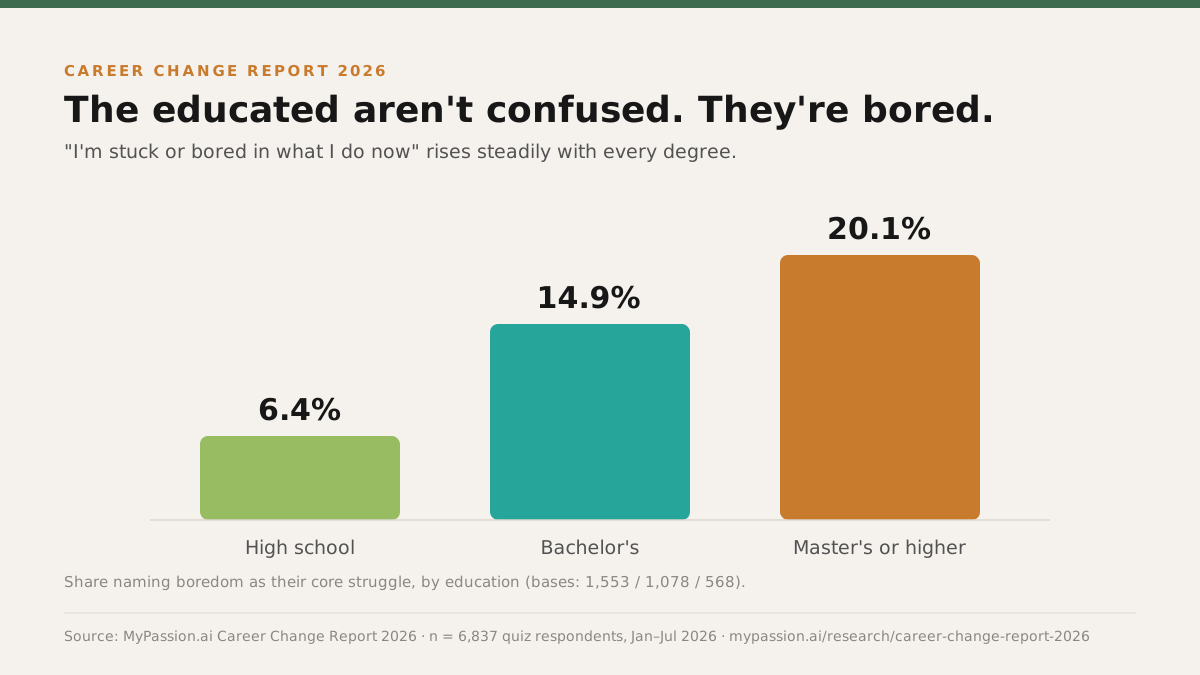
- 056.4% to 20.1% is how far the share naming boredom climbs across the formal degree ladder, from high school to master's level or above.
- 0622.6% of respondents with 8 or more years of experience name boredom, against 5.3% of those with none (n = 962 and 1,713).
- 0715.9% identify as specialists who master one subject. Among the well-paid group it falls to 12.2%, the lowest of any segment (n = 6,473 and 1,235).
- 0839.0% of people who say they have too many interests name that as their core struggle. No other group self-diagnoses so consistently (n = 690).
- 0965.0% of people returning after a career break describe themselves as stuck or going in circles (n = 203).
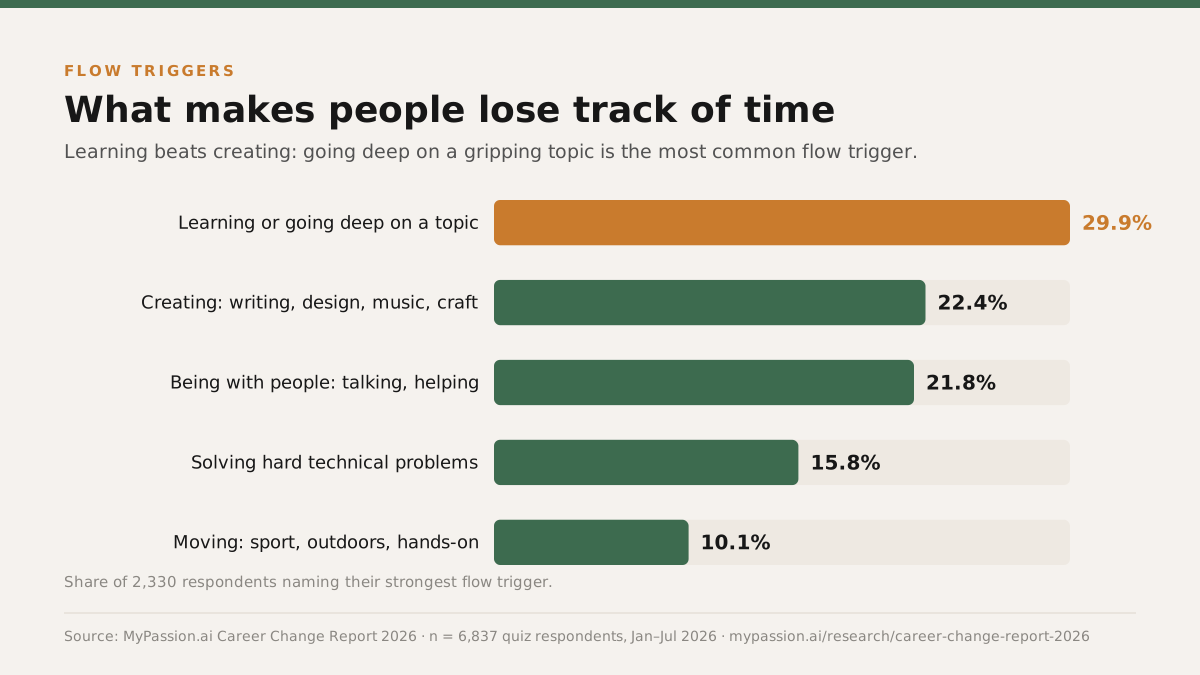
- 1029.9% name learning, going deep on a topic that grips them, as their strongest flow trigger, ahead of creating at 22.4% (n = 2,330).
- 11156 countries are represented, and the fifteen largest account for only 76.0% of respondents (n = 6,389).
- 126.9 min median time to complete the quiz; 75.4% of the 6,860 started sessions finished.
One in five is paid well and wants out anyway
Career quizzes are stereotyped as a student activity, and students are indeed the largest group: 45.6% of respondents describe themselves as a student or graduate with no clear direction. The surprise is the second-largest group. 19.1% are in a career that pays well and are seeking change regardless. They outnumber both the multi-interest group (18.7%) and the stuck-or-unemployed group (16.6%).
| Segment | Share | Base n |
|---|---|---|
| Student or graduate, no clear direction | 45.6% | 2,971 of 6,515 |
| In a well-paying career, seeking change | 19.1% | 1,247 of 6,515 |
| Too many interests, can't pick one | 18.7% | 1,216 of 6,515 |
| Stuck or unemployed, going in circles | 16.6% | 1,081 of 6,515 |
Source: MyPassion.ai Career Change Report 2026 (n = 6,515 respondents), dataset frozen 28 July 2026
Career doubt peaks at seniority, not at entry level
Inside the well-paid group, experience skews heavily senior: 59.2% have 8 or more years in the workforce, and 80.6% have at least four. The people most likely to be questioning a well-paying career are not restless juniors; they are the ones who have seen enough of the path to judge where it ends. The full breakdown of what that group says is wrong sits in The Golden Handcuffs Index.
The problem is self-knowledge, not options
Asked to name their core struggle, 52.9% of respondents pick one of two answers: they have no idea which direction to pick (26.5%), or they cannot tell what they are actually good at (26.4%). Only 20.5% describe the opposite problem of too many interests. Most career advice assumes people need more options. The data says most people need a clearer read on themselves.
| Segment | Share | Base n |
|---|---|---|
| No idea which direction to pick | 26.5% | 968 of 3,656 |
| Can't tell what they're good at | 26.4% | 965 of 3,656 |
| Too many interests to commit to one | 20.5% | 748 of 3,656 |
| Nothing they try feels like a passion | 15.1% | 552 of 3,656 |
| Stuck or bored in current work | 11.6% | 423 of 3,656 |
Source: MyPassion.ai Career Change Report 2026 (n = 3,656 respondents), dataset frozen 28 July 2026
The educated are not confused. They are bored.
Splitting the same struggle question by education produces the cleanest gradient in the dataset. The share who name boredom, being stuck in what they already do, rises with every degree: 6.4% of high-school respondents, 14.9% of bachelor's graduates, 20.1% at master's level or above. Education narrows the confusion and replaces it with a different question: this works, but is it what I want to keep doing?
Only 16% identify as specialists
Asked how they naturally work, respondents split almost evenly between improving what exists (29.0%), connecting ideas or people (28.1%), and starting new projects (27.0%). Deep single-subject mastery comes last at 15.9%. The classic instruction to find your one passion and go deep describes a sixth of the population and quietly misfires for the rest.
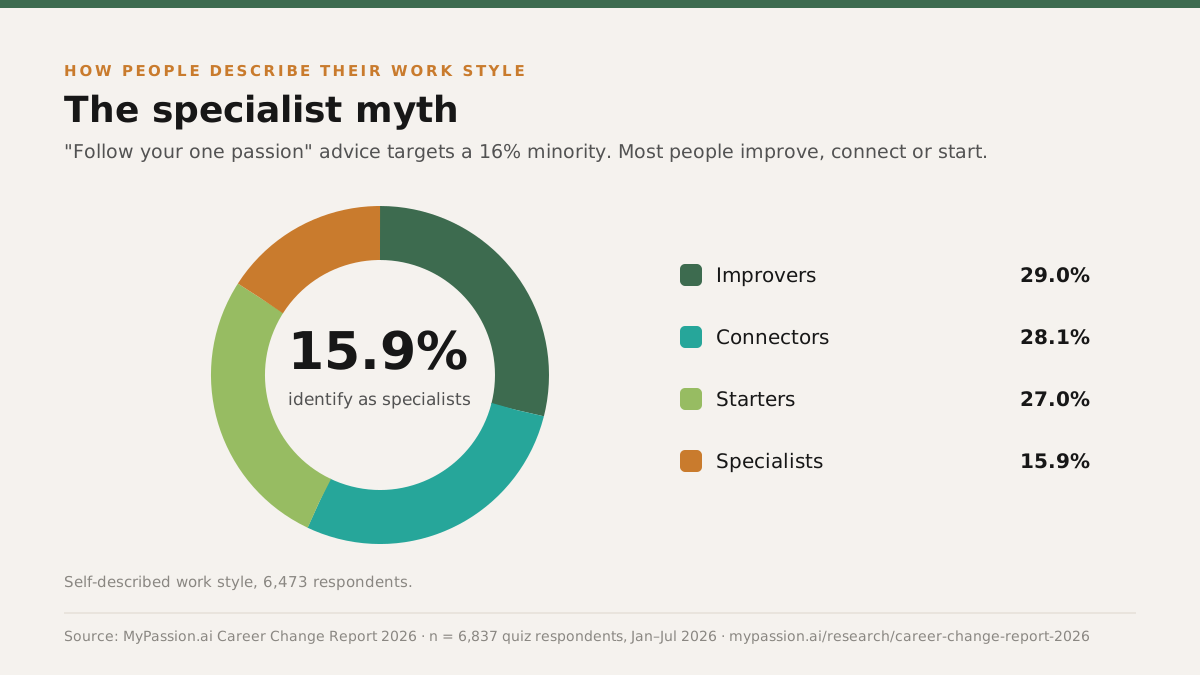
| Segment | Share | Base n |
|---|---|---|
| Improving what already exists | 29% | 1,876 of 6,473 |
| Connecting ideas or people | 28.1% | 1,820 of 6,473 |
| Starting new projects | 27% | 1,746 of 6,473 |
| Mastering one subject | 15.9% | 1,031 of 6,473 |
Source: MyPassion.ai Career Change Report 2026 (n = 6,473 respondents), dataset frozen 28 July 2026
Learning beats creating as a flow trigger
When respondents name the activity that makes them lose track of time, learning wins: 29.9% pick going deep on a topic that grips them, ahead of creating (22.4%), being with people (21.8%), technical problem-solving (15.8%), and physical activity (10.1%). Flow is the signal the MyPassion.ai quiz is built around, because what someone does without external pressure is the most honest data point they produce.
Career doubt is a global condition
Respondents came from 156 countries. The United States leads with 32.7%, followed by India (12.9%) and the United Kingdom (7.2%), but two-thirds of all responses come from outside the US. The fifteen largest countries together account for 76.0%, which leaves roughly a quarter of all responses spread across the remaining 141. The question behind this report is not an American anxiety; it shows up in every labor market the quiz reaches.
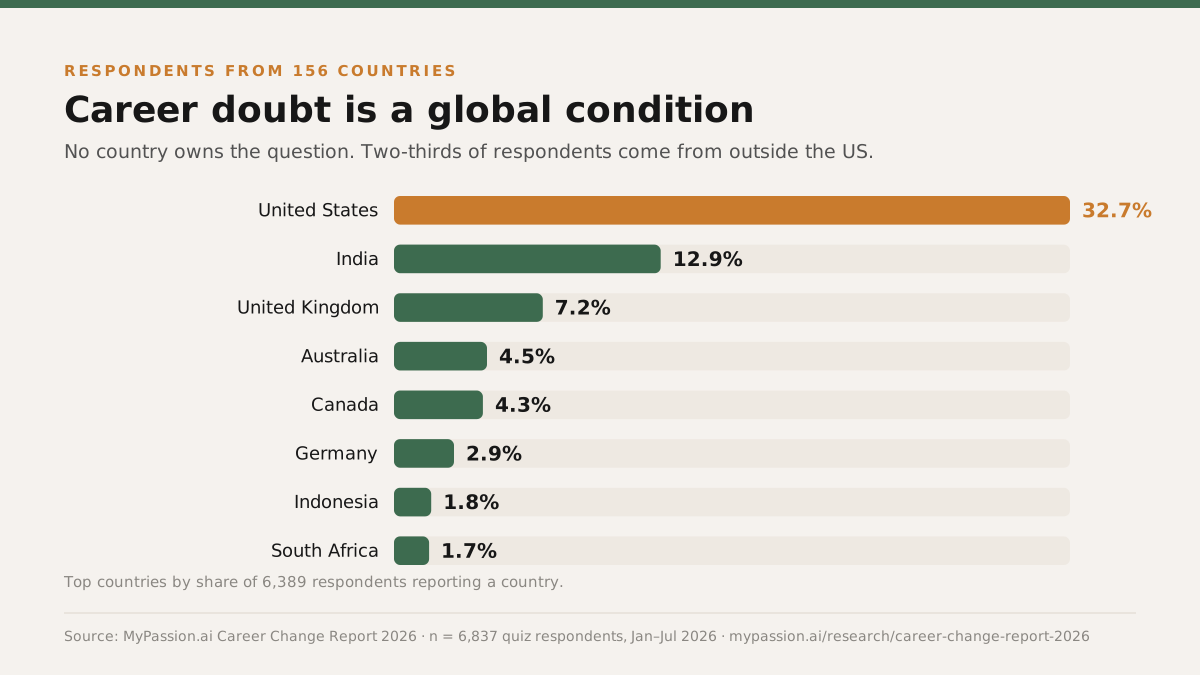
| Country | Share | Base n |
|---|---|---|
| United States | 32.7% | 2,087 of 6,389 |
| India | 12.9% | 824 of 6,389 |
| United Kingdom | 7.2% | 463 of 6,389 |
| Australia | 4.5% | 289 of 6,389 |
| Canada | 4.3% | 276 of 6,389 |
| Germany | 2.9% | 186 of 6,389 |
| Indonesia | 1.8% | 112 of 6,389 |
| South Africa | 1.7% | 110 of 6,389 |
| Pakistan | 1.6% | 100 of 6,389 |
| Malaysia | 1.2% | 78 of 6,389 |
| Netherlands | 1.2% | 78 of 6,389 |
| Philippines | 1.2% | 77 of 6,389 |
| New Zealand | 1.1% | 68 of 6,389 |
| United Arab Emirates | 0.9% | 57 of 6,389 |
| France | 0.8% | 52 of 6,389 |
Source: MyPassion.ai Career Change Report 2026 (n = 6,389 respondents), dataset frozen 28 July 2026
Crossing the dataset with itself
The seven findings above each read one question at a time. The published dataset has ten columns, so the more interesting material is in the crossings: what a segment says when you already know who they are. Every table below reads across its rows, each row on its own base, printed in the last column.
Each group has a different problem, and only one knows it
Crossing life situation against core struggle separates four populations that generic career advice treats as one. Boredom is almost entirely a well-paid phenomenon: 26.2% of that group name it, against 6.0% of students and 6.1% of the multi-interest group. Meanwhile the multi-interest group is the only segment that names its own label back at a high rate, with 39.0% picking too many interests, roughly double every other segment. People with too many interests know exactly what is wrong with them. Everyone else is guessing.
| No idea which direction to pick | Can't tell what they're good at | Too many interests to commit to one | Nothing they try feels like a passion | Stuck or bored in current work | Base n | |
|---|---|---|---|---|---|---|
| Student or graduate, no clear direction | 30% | 29.5% | 18.2% | 16.2% | 6% | 1,573 |
| In a well-paying career, seeking change | 21.8% | 21% | 15% | 16% | 26.2% | 714 |
| Too many interests, can't pick one | 21.7% | 23.2% | 39% | 10% | 6.1% | 690 |
| Stuck or unemployed, going in circles | 28% | 28.1% | 12.5% | 16.8% | 14.6% | 679 |
Source: MyPassion.ai Career Change Report 2026 (n = 3,656 respondents), dataset frozen 28 July 2026
| Answer | Share |
|---|---|
| No idea which direction to pick | 21.8% |
| Can't tell what they're good at | 21% |
| Too many interests to commit to one | 15% |
| Nothing they try feels like a passion | 16% |
| Stuck or bored in current work | 26.2% |

Boredom is not what career doubt looks like in general. It is what career doubt looks like once the money is already solved.
Boredom arrives with tenure, and a career break resets it
The same struggle question against years of experience shows boredom climbing steadily with tenure: 5.3% among people with no experience yet, 12.5% at one to three years, 12.8% at four to seven, and 22.6% at eight or more. The exception is the group that stepped away. Among people returning after a career break, boredom falls back to 7.7% and is replaced by directionlessness: 29.4% cannot name a direction and 28.0% cannot name a strength, the highest combined self-knowledge gap of any experience band.
| No idea which direction to pick | Can't tell what they're good at | Too many interests to commit to one | Nothing they try feels like a passion | Stuck or bored in current work | Base n | |
|---|---|---|---|---|---|---|
| No experience yet | 29.7% | 29.2% | 22.4% | 13.5% | 5.3% | 1,713 |
| 1-3 years | 25% | 27.7% | 19.1% | 15.7% | 12.5% | 440 |
| 4-7 years | 23.5% | 24.8% | 22.3% | 16.6% | 12.8% | 391 |
| 8+ years | 22.3% | 21.2% | 18% | 15.9% | 22.6% | 962 |
| Returning after a career break | 29.4% | 28% | 14% | 21% | 7.7% | 143 |
Source: MyPassion.ai Career Change Report 2026 (n = 3,649 respondents), dataset frozen 28 July 2026
Read together with Cut 1, this says the well-paid and the long-tenured are largely the same people, and boredom is what that combination produces. It also says a career break does not carry the boredom across. Time away appears to reset the problem to an earlier and harder one: not knowing what to aim at.
The education gradient is about degrees, not training
The published gradient covers the three formal-degree levels and rises cleanly across them. Adding the two non-degree routes breaks the line. Vocational and certification respondents name boredom at 12.7%, between high school and bachelor's. Self-taught and bootcamp respondents name it at 6.8%, essentially the high-school rate, despite typically working in skilled roles. Whatever the gradient is tracking, it is not simply years spent training.
| Answer | Share |
|---|---|
| High school | 6.4% |
| Vocational or certifications | 12.7% |
| Self-taught or bootcamp | 6.8% |
| Bachelor's degree | 14.9% |
| Master's degree or higher | 20.1% |

Read this one carefully
| No idea which direction to pick | Can't tell what they're good at | Too many interests to commit to one | Nothing they try feels like a passion | Stuck or bored in current work | Base n | |
|---|---|---|---|---|---|---|
| High school | 29.2% | 28.1% | 21.6% | 14.6% | 6.4% | 1,553 |
| Vocational or certifications | 24.8% | 24.5% | 22.5% | 15.4% | 12.7% | 306 |
| Self-taught or bootcamp | 29.5% | 30.1% | 22.6% | 11% | 6.8% | 146 |
| Bachelor's degree | 25.6% | 25.3% | 18.2% | 16% | 14.9% | 1,078 |
| Master's degree or higher | 21% | 23.4% | 20.1% | 15.5% | 20.1% | 568 |
Source: MyPassion.ai Career Change Report 2026 (n = 3,651 respondents), dataset frozen 28 July 2026
The fuller version of this finding, including what it means for how career advice is written for graduates, is in The Education Paradox.
The people furthest into a career are the least likely to call themselves specialists
Work style against life situation produces the finding that argues hardest with conventional advice. Specialists are the smallest group overall at 15.9%, and they are scarcest precisely where seniority is highest: only 12.2% of the well-paid group describe themselves as mastering one subject, against 18.5% of students. The well-paid group is instead the most likely to describe itself as improving what already exists, at 32.1%.
| Improving what already exists | Connecting ideas or people | Starting new projects | Mastering one subject | Base n | |
|---|---|---|---|---|---|
| Student or graduate, no clear direction | 28.4% | 28% | 25.2% | 18.5% | 2,948 |
| In a well-paying career, seeking change | 32.1% | 27.6% | 28% | 12.2% | 1,235 |
| Too many interests, can't pick one | 25.4% | 31.1% | 30.4% | 13% | 1,212 |
| Stuck or unemployed, going in circles | 31.1% | 25.8% | 26.8% | 16.3% | 1,078 |
Source: MyPassion.ai Career Change Report 2026 (n = 6,473 respondents), dataset frozen 28 July 2026
Students describe themselves as specialists more often than people with a decade of paid work behind them. That is the opposite of what a build-your-expertise narrative predicts, and it is consistent across the two largest segments on the page. One reading: specialisation is an identity people expect to grow into, and the ones who arrive discover the job was mostly improving what was already there.
What each group loses track of time doing
Flow triggers are the signal the quiz is built around, and they separate the segments more sharply than any other question. Learning leads everywhere, but the well-paid group is the most technical of the four at 21.1% and the least people-oriented at 16.7%, while students sit at 15.0% technical and 24.1% people. The stuck-or-unemployed group is the most learning-driven of all at 32.4%.
| Learning or going deep on a topic | Creating: writing, design, music, craft | Being with people | Solving hard technical problems | Moving: sport, outdoors, hands-on | Base n | |
|---|---|---|---|---|---|---|
| Student or graduate, no clear direction | 28.6% | 20.9% | 24.1% | 15% | 11.4% | 1,006 |
| In a well-paying career, seeking change | 30.7% | 20.7% | 16.7% | 21.1% | 10.9% | 479 |
| Too many interests, can't pick one | 29.7% | 24.8% | 23.4% | 14.2% | 7.9% | 431 |
| Stuck or unemployed, going in circles | 32.4% | 25.4% | 20.5% | 13.3% | 8.5% | 414 |
Source: MyPassion.ai Career Change Report 2026 (n = 2,330 respondents), dataset frozen 28 July 2026
How this data was collected and what it can claim
The data comes from the free MyPassion.ai career quiz. Between January 29 and July 28, 2026, 6,860 sessions were started and 6,837 produced a stored response; 75.4% of started sessions completed all questions, with a median completion time of 6.9 minutes.
This is a self-selected sample of people actively questioning their career, not a representative panel of all workers. We consider that a feature: it measures the population inside the question. It also means the numbers should not be read as national workforce shares, and no figure on this page should be presented as a prevalence estimate for any general population.
Questions were added and revised over the collection window, so each finding is computed only on respondents who answered the current version of that question, and the base is stated next to every number. Legacy answer formats were excluded rather than remapped. Percentages refer to their stated base, never to all 6,837 rows.
Country is self-reported. All free-text answers were removed from the published dataset to protect respondent privacy; only categorical fields are released. The full sampling frame, exclusion rules, suppression threshold, and the limits of what this data can support are set out on the how this research is made.
How to cite this page
Everything here is free to reuse under CC BY 4.0 with a link back. Charts, tables and the response-level dataset included.
MyPassion.AI (2026). The Career Change Report 2026. Career Change Report 2026. Retrieved from https://mypassion.ai/research/career-change-report-2026
The underlying dataset
Every figure on this page, including all five cross-tabs, is computed from one frozen file: 6,837 anonymized response rows, one per quiz response, with ten columns (month, country, education, years of experience, life situation, core struggle, work style, flow trigger, completion, duration band). No free text and no identifiers.
That file is not released. At nine attributes per row, most rows are a unique combination, so it is de-identified rather than anonymous and we treat it accordingly. The reasoning is set out under why the row-level file is not released.
What we do share, on request, is the aggregate table behind any figure here plus custom cuts of it, which is what checking a number actually requires. Email the research team and say what you are working on. Charts, tables and figures on this page are free to reuse right now under CC BY 4.0 with a link back.
More from the Career Change Report 2026
Every page below cuts the same 6,837 responses a different way. Same dataset, same methodology, different question.
Also in this series: job satisfaction statistics 2026, burnout statistics 2026, job hopping statistics 2026. The sampling frame, exclusions and suppression rules are in the research methodology, and the full index sits on the research hub. On the blog, career change at 30 and the multi-career generation put these findings next to what the labour statistics actually measure.
Frequently asked questions
These 6,837 people took seven minutes to get a clearer read on themselves. The same quiz is free, and your answers make the next report sharper.
Take the free career quiz
Research and analysis by Marco Kohns, founder of MyPassion.AI.
Published growth researcher (Journal of Business Research, Q1), MSc NOVA IMS Lisbon, and lecturer on AI for business at Católica Lisbon School of Business and Economics. Previously a growth product manager at a Silicon Valley scale-up operating in 100+ countries.
Disclosure: MyPassion.AI operates the career quiz that produced this data and sells a paid career report. Every figure states its base, the method is published in full, and we run custom cuts of the aggregate data for journalists and researchers on request.