
The Golden Handcuffs Index
One in five people questioning their career is already paid well. The obvious follow-up question is what they think is wrong, and until now we had not published the answer.
It is boredom, and the gap is not subtle. Being stuck or bored is the most common core struggle among well-paid career changers, at 26.2%. Among everyone else questioning their career it is the least common, at 8.0%. The same option ranks first for one group and last for the other.
A previously unpublished cross-tab from the Career Change Report 2026 dataset. Every figure states its base, is free to cite under CC BY 4.0, and reproduces from the published CSV.
The headline numbers
Each line is a complete claim with its own base, written to be quoted as it stands.
- 0126.2% vs 8.0% name being stuck or bored as their core struggle, well-paid career changers against everyone else. Top answer for one group, last for the other (n = 714 and 2,942).
- 0219.1% of people questioning their career are in well-paying work and seeking change, outnumbering the stuck or unemployed at 16.6% (n = 6,515).
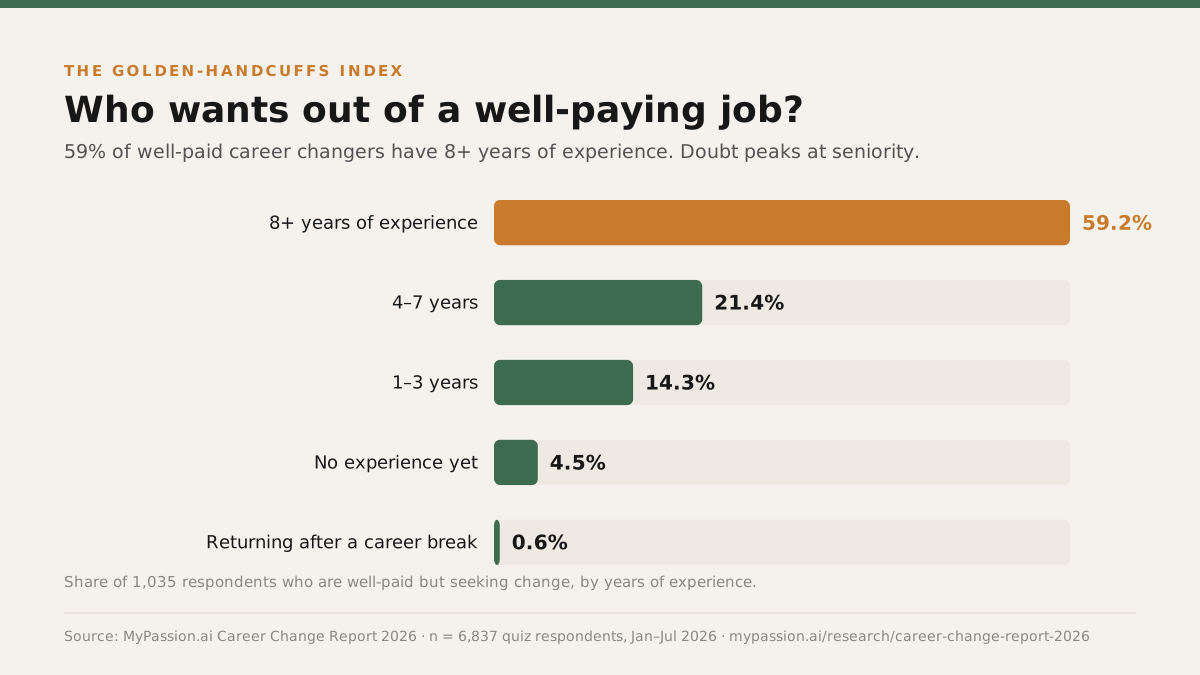
- 0359.2% of that group have 8 or more years of experience, and 80.6% have at least four (n = 1,035).
- 0477.8% hold a bachelor's degree or higher, against 43.4% across all respondents reporting education (n = 1,040 and 5,653).
- 0542.8% vs 55.3% name a self-knowledge problem. The well-paid group is relatively more certain about itself and relatively more bored.
- 0612.2% describe themselves as specialists mastering one subject, the lowest of any life-situation segment and below the 15.9% overall (n = 1,235).
The same struggle ranks first for one group and last for the other
Respondents pick one core career struggle from five fixed options. Splitting them by whether they describe themselves as well paid and seeking change produces two almost opposite orderings.
| Core struggle | Well paid, seeking changen = 714 | Everyone elsen = 2,942 |
|---|---|---|
| No idea which direction to pick | 21.8% | 27.6% |
| Can't tell what they're good at | 21% | 27.7% |
| Too many interests to commit to one | 15% | 21.8% |
| Nothing they try feels like a passion | 16% | 14.9% |
| Stuck or bored in current work | 26.2% | 8% |
Source: MyPassion.ai Career Change Report 2026 (n = 3,656 respondents), dataset frozen 28 July 2026
Boredom runs more than three times higher in the well-paid group. Every other option moves the other way or barely moves at all. The two self-knowledge options, not knowing which direction to pick and not being able to tell what you are good at, together account for 42.8% of the well-paid group against 55.3% of everyone else.
People in well-paying work who want out are more settled about who they are and less interested in what they are doing. Their problem is not a missing map. It is that the destination stopped being worth the trip.
| Answer | Share |
|---|---|
| No idea which direction to pick | 21.8% |
| Can't tell what they're good at | 21% |
| Too many interests to commit to one | 15% |
| Nothing they try feels like a passion | 16% |
| Stuck or bored in current work | 26.2% |

How the other three segments answer
Pooling everyone else into one column makes the contrast legible, but it hides that the remaining three segments are not alike either. Read across the full cross-tab and boredom turns out to be almost absent from two of them: 6.0% among students and 6.1% among the multi-interest group, rising to 14.6% among the stuck or unemployed. The well-paid group is not merely above average on boredom, it is roughly four times the two largest segments.
| No idea which direction to pick | Can't tell what they're good at | Too many interests to commit to one | Nothing they try feels like a passion | Stuck or bored in current work | Base n | |
|---|---|---|---|---|---|---|
| Student or graduate, no clear direction | 30% | 29.5% | 18.2% | 16.2% | 6% | 1,573 |
| In a well-paying career, seeking change | 21.8% | 21% | 15% | 16% | 26.2% | 714 |
| Too many interests, can't pick one | 21.7% | 23.2% | 39% | 10% | 6.1% | 690 |
| Stuck or unemployed, going in circles | 28% | 28.1% | 12.5% | 16.8% | 14.6% | 679 |
Source: MyPassion.ai Career Change Report 2026 (n = 3,656 respondents), dataset frozen 28 July 2026
Senior, credentialed, and looking for the exit
Of 6,515 people describing their life situation, 19.1% chose "in a well-paying career, seeking change". They outnumber the stuck or unemployed group at 16.6%. This is not a fringe of the career-change conversation, it is close to the centre of it.
They are also experienced. Within that group, 59.2% have eight or more years in the workforce and 80.6% have at least four (n = 1,035). Golden handcuffs take time to fit.
The education split is sharper still. 45.7% of the well-paid group hold a bachelor's degree and 32.1% a master's or higher, so 77.8% hold a degree of some kind, against 43.4% across all respondents reporting education. Only 1.9% came through a self-taught or bootcamp route. Whatever produces this group, the conventional credential path is most of it.
| High school | Vocational or certifications | Self-taught or bootcamp | Bachelor's degree | Master's degree or higher | Base n | |
|---|---|---|---|---|---|---|
| Student or graduate, no clear direction | 66.3% | 4.4% | 5.5% | 18.2% | 5.6% | 2,573 |
| Too many interests, can't pick one | 42.8% | 8.9% | 5.1% | 27.5% | 15.7% | 1,060 |
| In a well-paying career, seeking change | 10.8% | 9.5% | 1.9% | 45.7% | 32.1% | 1,040 |
| Stuck or unemployed, going in circles | 24.5% | 14.8% | 2.2% | 38% | 20.5% | 980 |
Source: MyPassion.ai Career Change Report 2026 (n = 5,653 respondents), dataset frozen 28 July 2026
The least specialist group in the dataset
If boredom followed from narrow work, this group would be the specialists. It is the opposite. Only 12.2% of the well-paid segment describe themselves as mastering one subject, the lowest share of any segment and below the 15.9% overall, while students sit at 18.5%. The well-paid group is instead the most likely of the four to describe itself as improving what already exists, at 32.1%.
| Improving what already exists | Connecting ideas or people | Starting new projects | Mastering one subject | Base n | |
|---|---|---|---|---|---|
| Student or graduate, no clear direction | 28.4% | 28% | 25.2% | 18.5% | 2,948 |
| In a well-paying career, seeking change | 32.1% | 27.6% | 28% | 12.2% | 1,235 |
| Too many interests, can't pick one | 25.4% | 31.1% | 30.4% | 13% | 1,212 |
| Stuck or unemployed, going in circles | 31.1% | 25.8% | 26.8% | 16.3% | 1,078 |
Source: MyPassion.ai Career Change Report 2026 (n = 6,473 respondents), dataset frozen 28 July 2026
Flow triggers point the same way. The well-paid group is the most technical of the four at 21.1% and the least people-oriented at 16.7%, against 15.0% and 24.1% for students. A profile emerges: technically inclined, a decade in, degree-holding, not especially specialised, and bored.
| Learning or going deep on a topic | Creating: writing, design, music, craft | Being with people | Solving hard technical problems | Moving: sport, outdoors, hands-on | Base n | |
|---|---|---|---|---|---|---|
| Student or graduate, no clear direction | 28.6% | 20.9% | 24.1% | 15% | 11.4% | 1,006 |
| In a well-paying career, seeking change | 30.7% | 20.7% | 16.7% | 21.1% | 10.9% | 479 |
| Too many interests, can't pick one | 29.7% | 24.8% | 23.4% | 14.2% | 7.9% | 431 |
| Stuck or unemployed, going in circles | 32.4% | 25.4% | 20.5% | 13.3% | 8.5% | 414 |
Source: MyPassion.ai Career Change Report 2026 (n = 2,330 respondents), dataset frozen 28 July 2026
Two groups, two different interventions
Most career advice is written for the second column of Table 1. It assumes the reader does not yet know what they are good at or which direction to take, and it prescribes exploration: assessments, informational interviews, trying things. For the 55.3% of everyone else who name a self-knowledge problem, that is the right prescription.
Handed to someone whose actual answer was stuck or bored, the same advice asks them to solve a problem they do not have. More self-discovery does not address a role that has stopped being interesting. That mismatch is a plausible reason this group stays put for years while reading a great deal about leaving.
It also connects to a pattern published separately: the share naming stuck or bored rises with every level of formal education, from 6.4% at high school to 20.1% at master's level, set out in The Education Paradox. Given that 77.8% of this group hold a degree, the two findings are describing overlapping populations rather than two independent effects.
What this does not show
How this cut was computed
The cross-tab covers responses collected between January 29 and July 28, 2026, the same frozen dataset as the Career Change Report 2026. It includes only respondents who answered both the life-situation and core-struggle questions using the current value sets. Responses recorded against superseded question versions are excluded rather than remapped.
That gives 714 well-paid respondents seeking change and 2,942 other respondents. The two groups are disjoint and sum to 3,656, which is exactly the report's core-struggle base, so no figure here sits on a base the report does not also publish. Percentages in Table 1 run down each column; percentages in Tables 2 to 5 run across each row, on that row's own base.
This is a self-selected sample of people actively questioning their career, not a representative population panel. The full sampling frame, exclusion rules and limitations are on the our research methodology, and the response-level aggregate tables behind every figure, and custom cuts of them, go to journalists and researchers on request: email the research team.
How to cite this page
Everything here is free to reuse under CC BY 4.0 with a link back. Charts, tables and the response-level dataset included.
MyPassion.AI (2026). The Golden Handcuffs Index. Career Change Report 2026. Retrieved from https://mypassion.ai/research/golden-handcuffs-index
More from the Career Change Report 2026
Every page below cuts the same 6,837 responses a different way. Same dataset, same methodology, different question.
Also in this series: career change statistics 2026, burnout statistics 2026, job hopping statistics 2026. The sampling frame, exclusions and suppression rules are in the research methodology, and the full index sits on the research hub. On the blog, is it too late to change careers and careers that make you happy pick up where the index stops.
Questions about this finding
They do not need to find themselves. They need work that is worth their attention again.
Take the free career quiz
Research and analysis by Marco Kohns, founder of MyPassion.AI.
Published growth researcher (Journal of Business Research, Q1), MSc NOVA IMS Lisbon, and lecturer on AI for business at Católica Lisbon School of Business and Economics. Previously a growth product manager at a Silicon Valley scale-up operating in 100+ countries.
Disclosure: MyPassion.AI operates the career quiz that produced this data and sells a paid career report. Every figure states its base, the method is published in full, and we run custom cuts of the aggregate data for journalists and researchers on request.