
Job Satisfaction Statistics 2026
Job satisfaction in the United States is at a 39-year high. That is the headline number, and on its own it is close to useless for anyone trying to understand why people leave careers they are good at.
This page does two things. It states the workforce-wide rate with its source and its limits, and it then describes what dissatisfaction actually consists of, using first-party data from 6,837 people who were questioning their career at the moment they answered.
Satisfaction rates belong to The Conference Board and are cited to them. First-party figures state their base, are free to cite under CC BY 4.0, and reproduce from the published dataset.
The headline numbers
Each line is a complete claim with its own base and source, written to be quoted as it stands.
- 0168.9% of US workers report being satisfied with their job, the highest reading in 39 years of tracking (The Conference Board, June 2026).
- 0219.1% of people questioning their career are in jobs that pay well and want out anyway. Pay does not settle the question (n = 6,515).
- 0359.2% of those well-paid leavers have 8 or more years of experience. Dissatisfaction peaks at seniority, not at entry level (n = 1,035).
- 0426.2% vs 8.0% name boredom as their core struggle, well-paid respondents against everyone else. Dissatisfaction has different contents in different segments (n = 714 and 2,942).
- 0552.9% name a self-knowledge problem as their core struggle rather than a shortage of options (n = 3,656).
- 066.4% to 20.1% is how far the share naming boredom rises across the formal degree ladder: high school 6.4%, bachelor's 14.9%, master's or higher 20.1%.
- 0729.9% name learning, going deep on a topic that grips them, as their strongest flow trigger. It beats creating at 22.4% (n = 2,330).
Job satisfaction is at a 39-year high
The longest-running measure of US job satisfaction is The Conference Board's Job Satisfaction survey, published in June 2026. It puts overall satisfaction at 68.9%, up from 68.3% a year earlier and the highest level in the series' 39-year history. The low point was 42.6% in 2010, in the aftermath of the Great Recession.
Read plainly, that is a 16-year climb and genuinely good news. It is also a ceiling on what this kind of statistic can tell you. Roughly three in ten workers sit outside that number, and a single satisfaction rate says nothing about what their dissatisfaction consists of, whether money would fix it, or whether it fades with experience.
For the rest of this page we stop counting how many people are unhappy and start describing what unhappy is made of.
The published figures disagree because they measure different things
Job satisfaction, engagement, wellbeing and quit rates get reported interchangeably and they are not the same measurement. They can move in opposite directions in the same year without any of them being wrong. Before quoting any figure on this topic, check what was asked, of whom, and when.
| Source | What it measures | Population | Cadence |
|---|---|---|---|
| The Conference Board Job Satisfaction | Whether workers say they are satisfied with their current job overall, plus component measures | US workers | Annual, running 39 years |
| BLS JOLTS | Quits, hires and separations. Behaviour, not feeling. A low quits rate can mean contentment or it can mean a frozen labour market | US nonfarm establishments | Monthly |
| BLS employee tenure | Median years with current employer. Often read as loyalty, though it moves with hiring conditions and workforce age | US wage and salary workers | Every two years |
| MyPassion.AI Career Change Report 2026 | What people questioning their career name as their core struggle. No satisfaction scale is asked, so this produces no satisfaction rate | Self-selected career quiz respondents, 156 countries | Frozen dataset, 29 Jan to 28 Jul 2026 |
Compiled by MyPassion.AI. Each source's figures belong to that source and should be cited to it directly.
What this page will not give you
One in five people wanting out is already paid well
Of 6,515 people describing their situation while looking for career direction, 19.1% chose "in a well-paying career, seeking change". They outnumber the stuck-or-unemployed group at 16.6% and the multi-interest group at 18.7%. The largest group remains students and graduates with no clear direction, at 45.6%.
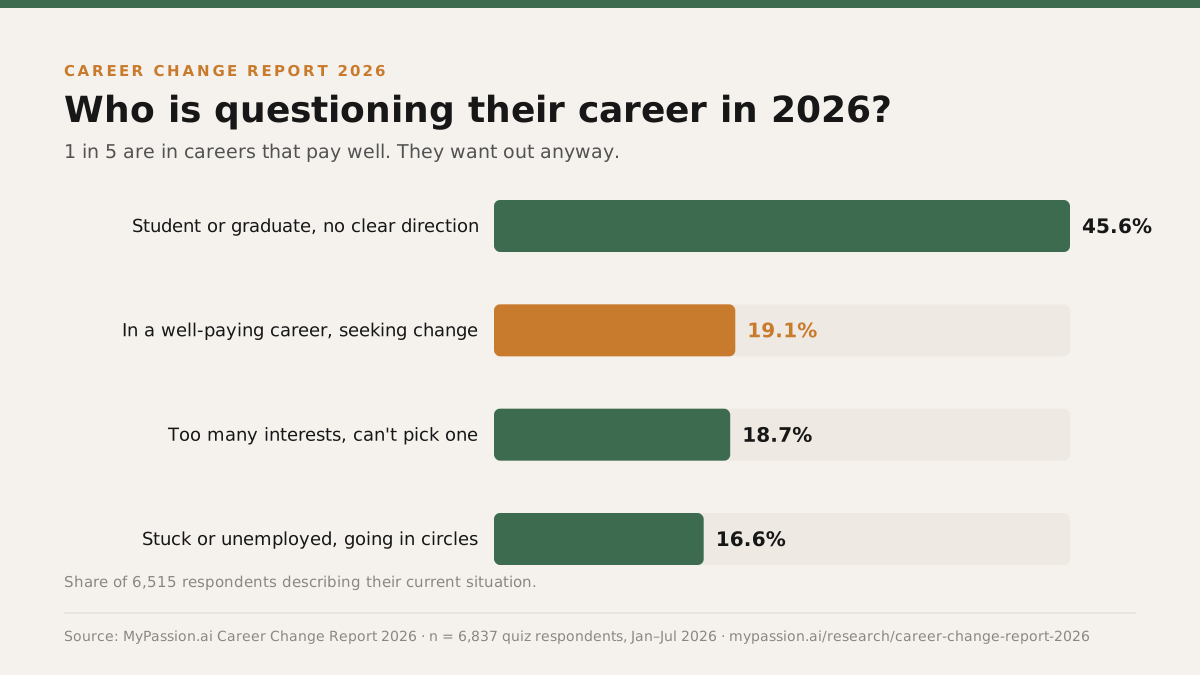
| Segment | Share | Base n |
|---|---|---|
| Student or graduate, no clear direction | 45.6% | 2,971 of 6,515 |
| In a well-paying career, seeking change | 19.1% | 1,247 of 6,515 |
| Too many interests, can't pick one | 18.7% | 1,216 of 6,515 |
| Stuck or unemployed, going in circles | 16.6% | 1,081 of 6,515 |
Source: MyPassion.ai Career Change Report 2026 (n = 6,515 respondents), dataset frozen 28 July 2026
Dissatisfaction has different contents in different groups
This is the finding a single satisfaction rate cannot reach. Crossing life situation against core struggle separates four populations that a summary number treats as one. Boredom is almost entirely a well-paid phenomenon: 26.2% of that group name it, against 6.0% of students and 6.1% of the multi-interest group. Self-knowledge problems run the other way, accounting for 59.5% of students against 42.8% of the well-paid group.
| No idea which direction to pick | Can't tell what they're good at | Too many interests to commit to one | Nothing they try feels like a passion | Stuck or bored in current work | Base n | |
|---|---|---|---|---|---|---|
| Student or graduate, no clear direction | 30% | 29.5% | 18.2% | 16.2% | 6% | 1,573 |
| In a well-paying career, seeking change | 21.8% | 21% | 15% | 16% | 26.2% | 714 |
| Too many interests, can't pick one | 21.7% | 23.2% | 39% | 10% | 6.1% | 690 |
| Stuck or unemployed, going in circles | 28% | 28.1% | 12.5% | 16.8% | 14.6% | 679 |
Source: MyPassion.ai Career Change Report 2026 (n = 3,656 respondents), dataset frozen 28 July 2026
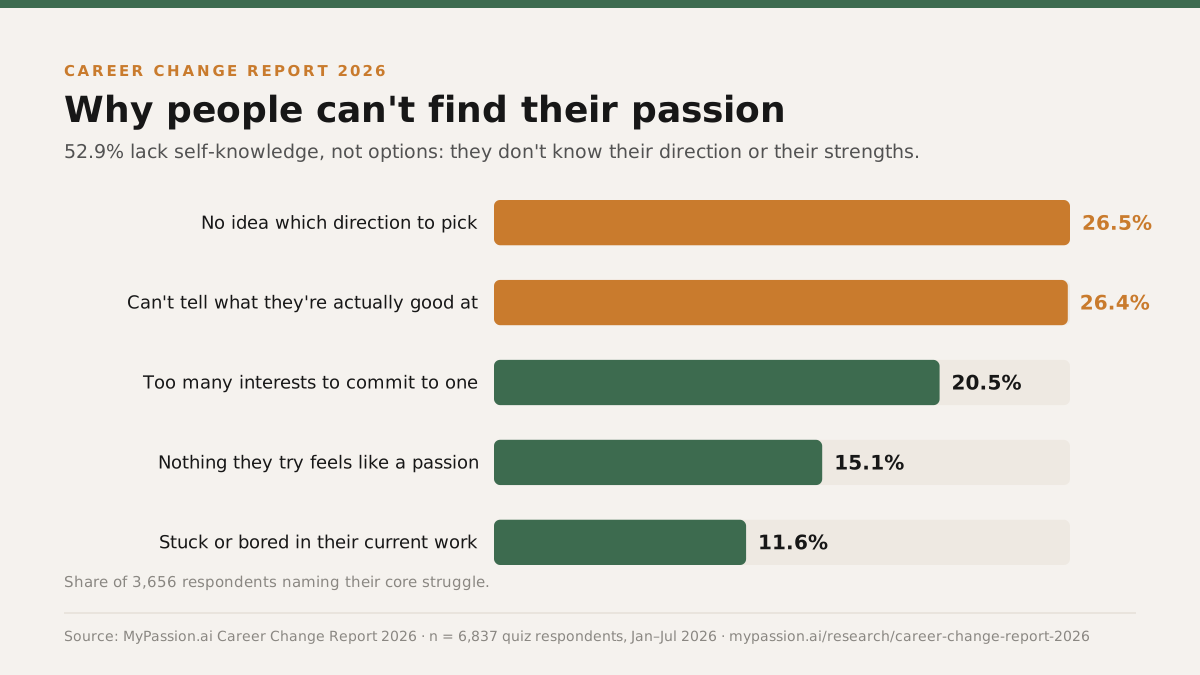
Pooled across everyone, 52.9% name one of the two self-knowledge options. That is the headline for the sample as a whole, and the cross-tab above is the reason it should not be applied to any particular group. The deeper treatment of the well-paid segment is in The Golden Handcuffs Index.
Dissatisfaction does not fade with experience, it changes shape
Among 1,035 well-paid respondents seeking change, 59.2% have eight or more years of experience and 80.6% have at least four. Read the other way round, the pattern is starker still: of respondents with eight or more years, 46.6% are in the well-paid seeking-change segment, against 1.7% of those with no experience yet.
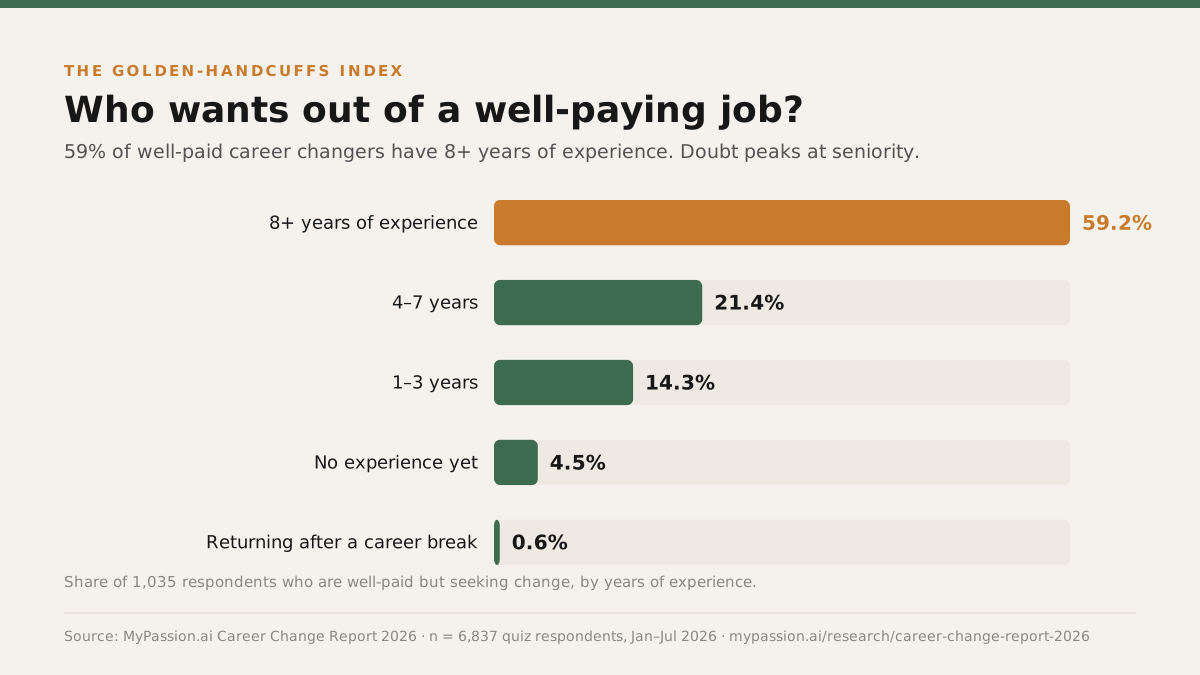
| Student or graduate, no clear direction | Too many interests, can't pick one | In a well-paying career, seeking change | Stuck or unemployed, going in circles | Base n | |
|---|---|---|---|---|---|
| No experience yet | 75.8% | 16.6% | 1.7% | 6% | 2,791 |
| 1-3 years | 37.2% | 18.2% | 20.4% | 24.1% | 725 |
| 4-7 years | 17.7% | 21.3% | 36.2% | 24.8% | 610 |
| 8+ years | 4.6% | 21.9% | 46.6% | 26.9% | 1,316 |
| Returning after a career break | 9.4% | 22.7% | n/a | 65% | 203 |
Source: MyPassion.ai Career Change Report 2026 (n = 5,645 respondents), dataset frozen 28 July 2026
The career-break row is the sharpest in the table: 65.0% of people returning after a break describe themselves as stuck or going in circles, more than double any other experience band. Time away from work does not read as a reset in this data. It reads as the hardest position to be in.
The people who are surest about their situation answer fastest
The dataset carries how long each respondent took, in bands. It is a crude engagement measure, but it is behaviour rather than self-report, and it separates the segments in a direction worth noting. The well-paid group is the quickest: 15.5% finish in under four minutes and 49.3% inside eight. The stuck-or-unemployed group is the slowest, with 13.9% taking over fifteen minutes, and the multi-interest group is close behind at 12.0%.
| Under 4 minutes | 4 to 8 minutes | 8 to 15 minutes | Over 15 minutes | Base n | |
|---|---|---|---|---|---|
| Student or graduate, no clear direction | 14.2% | 48.1% | 28% | 9.6% | 2,157 |
| In a well-paying career, seeking change | 15.5% | 49.3% | 26.5% | 8.7% | 941 |
| Too many interests, can't pick one | 9.9% | 45.7% | 32.4% | 12% | 901 |
| Stuck or unemployed, going in circles | 10.5% | 44.5% | 31.1% | 13.9% | 869 |
Source: MyPassion.ai Career Change Report 2026 (n = 4,868 respondents), dataset frozen 28 July 2026
The plainest reading is that answering a question about yourself is quicker when you already know the answer. People who are paid well and bored are not deliberating over what their situation is; they know. People who are stuck, or holding several directions at once, take longer over the same questions.
What absorbing work has in common
Satisfaction surveys measure whether people are content. The more useful question for anyone trying to fix a career is what makes work absorbing in the first place. Asked what most reliably puts them in flow, 29.9% of 2,330 respondents name learning, going deep on a topic that grips them, ahead of creating at 22.4%, being with people at 21.8%, technical problem-solving at 15.8%, and physical activity at 10.1%.
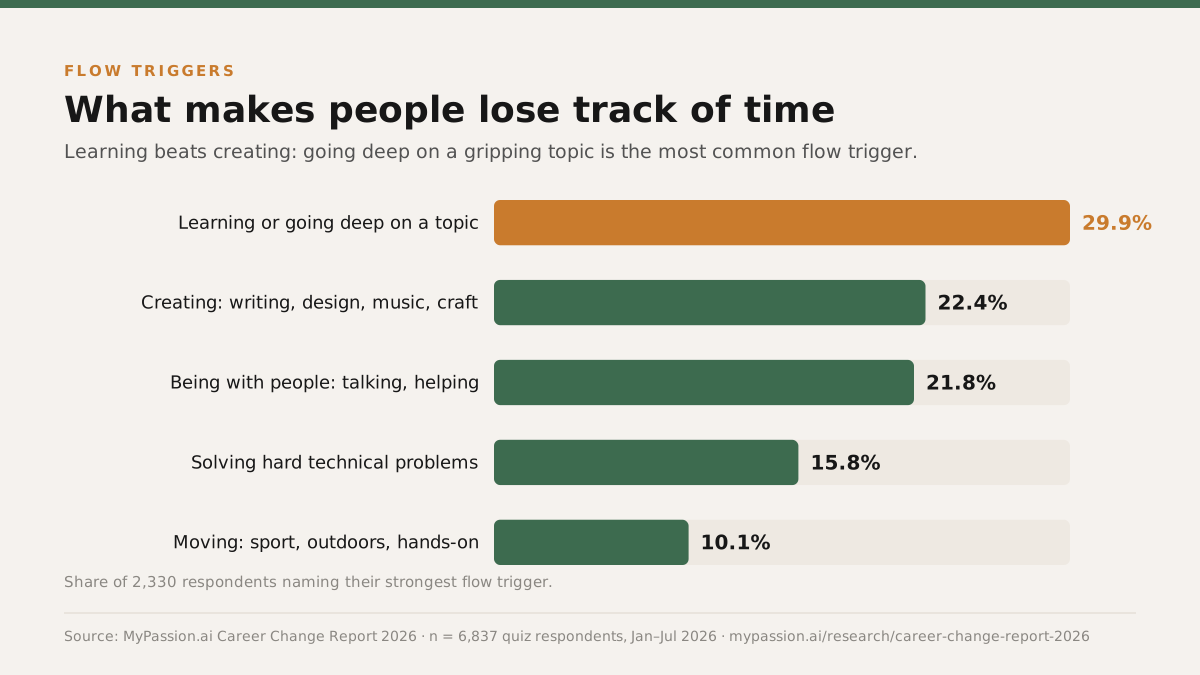
Set that beside the education gradient, where the share naming boredom rises from 6.4% at high school to 20.1% at master's level, and a coherent story appears: the people most trained to expect learning from work are the most likely to report its absence. That is set out in The Education Paradox.
What each figure here can and cannot claim
Satisfaction rates on this page are The Conference Board's and are cited to them. We do not restate, adjust or recompute them, and we do not produce a satisfaction rate of our own, because the MyPassion.AI quiz contains no satisfaction scale.
Every first-party figure comes from the frozen Career Change Report 2026 dataset: 6,837 anonymized responses collected between January 29 and July 28, 2026. This is a self-selected sample of people actively questioning their career, so it describes the anatomy of dissatisfaction rather than its prevalence. Nothing here supports a claim about how many workers are dissatisfied.
Bases vary by field because questions were added over the collection window and some can be skipped, so each figure states the base it sits on. Any cross-tab row under 100 respondents is suppressed. The full sampling frame, exclusion rules and limitations are on the our research methodology, and the dataset aggregate tables behind every first-party figure, and custom cuts of them, go to journalists and researchers on request: email the research team.
How to cite this page
Everything here is free to reuse under CC BY 4.0 with a link back. Charts, tables and the response-level dataset included.
MyPassion.AI (2026). Job Satisfaction Statistics 2026. Career Change Report 2026. Retrieved from https://mypassion.ai/research/job-satisfaction-statistics
More from the Career Change Report 2026
Every page below cuts the same 6,837 responses a different way. Same dataset, same methodology, different question.
Also in this series: career change statistics 2026, the education paradox, job hopping statistics 2026. The sampling frame, exclusions and suppression rules are in the research methodology, and the full index sits on the research hub. On the blog, careers that make you happy turns the satisfaction question into a shortlist.
Questions about these statistics
A satisfaction rate tells you how many people are unhappy. It never tells you what would fix it.
Take the free career quiz
Research and analysis by Marco Kohns, founder of MyPassion.AI.
Published growth researcher (Journal of Business Research, Q1), MSc NOVA IMS Lisbon, and lecturer on AI for business at Católica Lisbon School of Business and Economics. Previously a growth product manager at a Silicon Valley scale-up operating in 100+ countries.
Disclosure: MyPassion.AI operates the career quiz that produced this data and sells a paid career report. Every figure states its base, the method is published in full, and we run custom cuts of the aggregate data for journalists and researchers on request.