
The Education Paradox
Education is the most reliable lever we have for earnings and employment. In our data it is also the strongest single predictor of one specific complaint: being stuck or bored in the work you already do.
The share naming that as their core career struggle triples between high school and a master's degree, across 3,199 respondents. This page publishes the gradient, the two non-degree routes that break it, and what happens to it when career stage is held constant, which is the first thing a careful reader will want to know.
From 6,837 responses to the MyPassion.ai career quiz, January to July 2026, across 156 countries. Every statistic states its base, is free to cite under CC BY 4.0, and reproduces from the published dataset.
The headline numbers
Each line is a complete claim with its own base, written to be quoted as it stands.
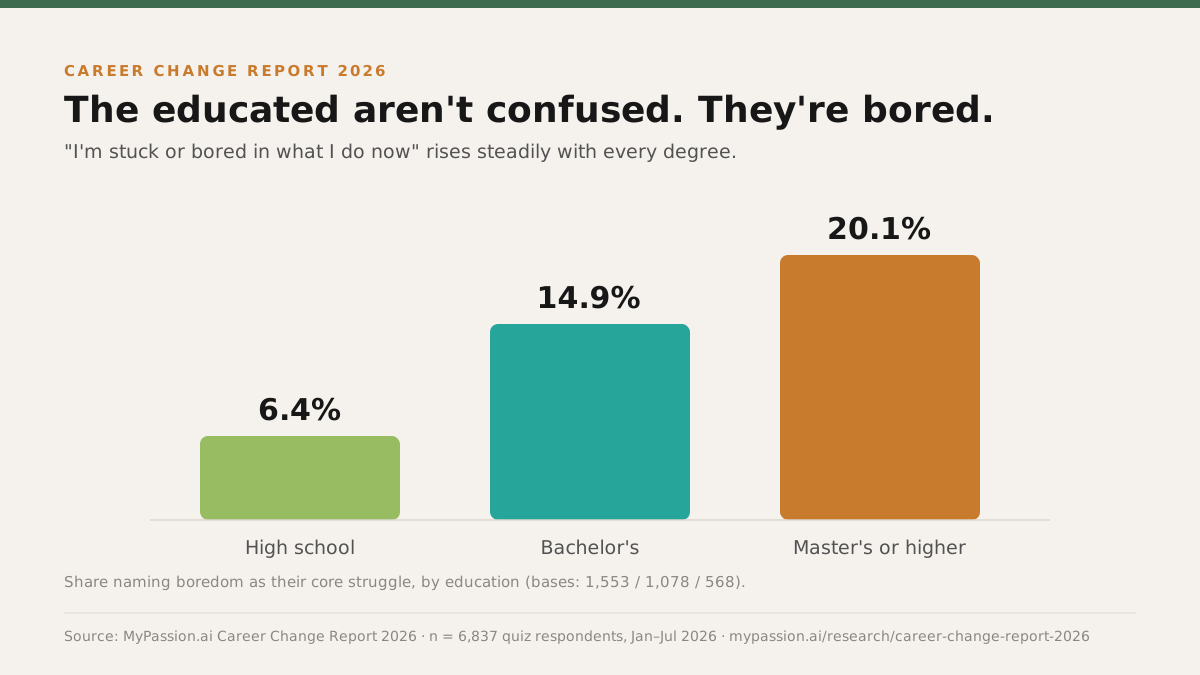
- 016.4% to 20.1% is how far the share naming stuck or bored as their core career struggle rises across the formal degree ladder: high school 6.4%, bachelor's 14.9%, master's or higher 20.1% (bases 1,553 / 1,078 / 568).
- 0212.7% and 6.8% are the rates for the two non-degree routes, vocational and self-taught. The ladder is about degrees, not about time spent training (n = 306 and 146).
- 034.9% to 15.4% is the same gradient among people with under eight years of experience. It survives when career stage is held roughly constant, but it narrows.
- 0420.3% to 26.4% is the gradient among people with eight or more years. At that stage education separates the groups by six points, where tenure separates them by fifteen.
- 0547.2% vs 7.1% share with eight or more years of experience, master's respondents against high-school respondents. This is the confound the controlled split exists to address (n = 843 and 2,508).
- 0636.1% of master's respondents name learning as their strongest flow trigger, the highest of any education level, against 27.3% at high school (n = 360 and 970).
- 0743.4% of respondents reporting education hold a bachelor's degree or higher, and 14.9% hold a master's or higher (n = 5,653).
Stuck or bored triples between high school and a master's
Respondents pick one core career struggle from a fixed set. One option reads "I'm stuck or bored in what I do now". The share choosing it climbs at every step of the formal degree ladder: 6.4% of high-school respondents, 14.9% of bachelor's graduates, and 20.1% of those with a master's degree or higher. Bases are 1,553, 1,078, and 568 respectively.
A three-times spread across three ordered groups, each with a base in the hundreds, is not the kind of pattern that appears and disappears between samples. What it means is more open, and worth stating carefully rather than overselling. More education tends to buy work with more autonomy and more scope, which should reduce boredom. It also raises what a person expects work to give them, and it trains an appetite for difficulty that ordinary jobs may not feed.
The two routes that break the line
The published gradient covers the three formal-degree levels. The dataset carries two more education routes, and adding them breaks the line. Vocational and certification respondents name being stuck or bored at 12.7%, sitting between high school and bachelor's. Self-taught and bootcamp respondents name it at 6.8%, essentially the high-school rate, despite typically working in skilled roles.
| Answer | Share |
|---|---|
| High school | 6.4% |
| Vocational or certifications | 12.7% |
| Self-taught or bootcamp | 6.8% |
| Bachelor's degree | 14.9% |
| Master's degree or higher | 20.1% |

Read the self-taught band carefully
Whatever the ladder is tracking, it is not simply time spent training. It is the degree.
| No idea which direction to pick | Can't tell what they're good at | Too many interests to commit to one | Nothing they try feels like a passion | Stuck or bored in current work | Base n | |
|---|---|---|---|---|---|---|
| High school | 29.2% | 28.1% | 21.6% | 14.6% | 6.4% | 1,553 |
| Vocational or certifications | 24.8% | 24.5% | 22.5% | 15.4% | 12.7% | 306 |
| Self-taught or bootcamp | 29.5% | 30.1% | 22.6% | 11% | 6.8% | 146 |
| Bachelor's degree | 25.6% | 25.3% | 18.2% | 16% | 14.9% | 1,078 |
| Master's degree or higher | 21% | 23.4% | 20.1% | 15.5% | 20.1% | 568 |
Source: MyPassion.ai Career Change Report 2026 (n = 3,651 respondents), dataset frozen 28 July 2026
The rest of the row is as informative as the boredom column. Self-knowledge problems, the two leftmost options, fall steadily as education rises: 57.3% combined at high school against 44.4% at master's level. More education does appear to buy a clearer read on yourself. It just does not buy interest in the work.
Is this education, or is it tenure?
This is the objection to the headline, and it is a good one. Education and career stage are tangled together in any sample of working adults, and they are badly tangled in this one. Of master's respondents, 47.2% have eight or more years of experience. Of high-school respondents, 7.1% do, and 78.2% have no experience yet. The education ladder in this dataset is also a tenure ladder, and boredom is known from the report to rise with tenure.
| No experience yet | 1-3 years | 4-7 years | 8+ years | Returning after a career break | Base n | |
|---|---|---|---|---|---|---|
| High school | 78.2% | 8.9% | 4.6% | 7.1% | 1.2% | 2,508 |
| Vocational or certifications | 21.9% | 13.4% | 15.4% | 41.8% | 7.4% | 447 |
| Self-taught or bootcamp | 79.7% | 4.2% | 5.1% | 9.3% | n/a | 236 |
| Bachelor's degree | 26.6% | 20.3% | 15.1% | 33.1% | 4.9% | 1,606 |
| Master's degree or higher | 13.9% | 12.5% | 19.7% | 47.2% | 6.8% | 843 |
Source: MyPassion.ai Career Change Report 2026 (n = 5,640 respondents), dataset frozen 28 July 2026
The way to read them apart is to ask the same question inside a fixed career stage. Splitting experience into two bands keeps the bases usable where a five-way split would suppress almost every cell. The gradient survives in both bands, and it narrows sharply.
| Career stage | High school | Vocational or certifications | Self-taught or bootcamp | Bachelor's degree | Master's degree or higher |
|---|---|---|---|---|---|
| Under 8 years of experience | 4.9%n = 1,401 | 11.3%n = 141 | 3.9%n = 129 | 10.8%n = 627 | 15.4%n = 241 |
| 8 or more years of experience | 20.3%n = 128 | 15.6%n = 141 | n/an = 15 | 22.6%n = 394 | 26.4%n = 284 |
Source: MyPassion.ai Career Change Report 2026 (n = 6,837 respondents), dataset frozen 28 July 2026
Among people with under eight years of experience, the degree ladder runs 4.9% to 10.8% to 15.4%. Among people with eight or more, it runs 20.3% to 22.6% to 26.4%. So education still separates the groups at both stages, and the finding is not an artefact. But the sizes are worth comparing directly: at the senior stage, education spreads the three degree levels across six points, while moving from under-eight to eight-plus years moves a high-school respondent by more than fifteen, from 4.9% to 20.3%.
Education raises the odds of being bored. Tenure raises them further. The paradox holds, and most of its size belongs to time served rather than to the degree.
These are not people short on credentials
Of 5,653 respondents reporting education, 43.4% hold a bachelor's degree or higher and 14.9% hold a master's degree or higher. The people arriving at a career quiz because they do not know what to do next are, disproportionately, the people who did the thing they were told would answer that question.
| Segment | Share | Base n |
|---|---|---|
| High school | 44.4% | 2,512 of 5,653 |
| Vocational or certifications | 8% | 451 of 5,653 |
| Self-taught or bootcamp | 4.2% | 237 of 5,653 |
| Bachelor's degree | 28.4% | 1,608 of 5,653 |
| Master's degree or higher | 14.9% | 845 of 5,653 |
Source: MyPassion.ai Career Change Report 2026 (n = 5,653 respondents), dataset frozen 28 July 2026
A degree is a strong signal of employability. On this evidence it is a weak signal of direction. The primary source for what education does to earnings and unemployment is the U.S. Bureau of Labor Statistics Education pays series, which measures the economy-wide returns this page does not attempt to estimate.
Where each education level sits in the career-doubt population is its own finding. Master's respondents are the most likely of any group to be in the well-paid, seeking-change segment, at 39.5%, against 4.5% of high-school respondents. Vocational respondents are the most likely to describe themselves as stuck or unemployed, at 32.2%.
| Student or graduate, no clear direction | Too many interests, can't pick one | In a well-paying career, seeking change | Stuck or unemployed, going in circles | Base n | |
|---|---|---|---|---|---|
| High school | 67.9% | 18.1% | 4.5% | 9.6% | 2,512 |
| Vocational or certifications | 25.1% | 20.8% | 22% | 32.2% | 451 |
| Self-taught or bootcamp | 59.5% | 22.8% | 8.4% | 9.3% | 237 |
| Bachelor's degree | 29.2% | 18.2% | 29.5% | 23.1% | 1,608 |
| Master's degree or higher | 17% | 19.6% | 39.5% | 23.8% | 845 |
Source: MyPassion.ai Career Change Report 2026 (n = 5,653 respondents), dataset frozen 28 July 2026
The most educated are also the most learning-driven
Asked what most reliably puts them in flow, 29.9% of 2,330 respondents name learning, going deep on a topic that grips them. It beats creating at 22.4%, being with people at 21.8%, technical problem-solving at 15.8%, and physical activity at 10.1%.
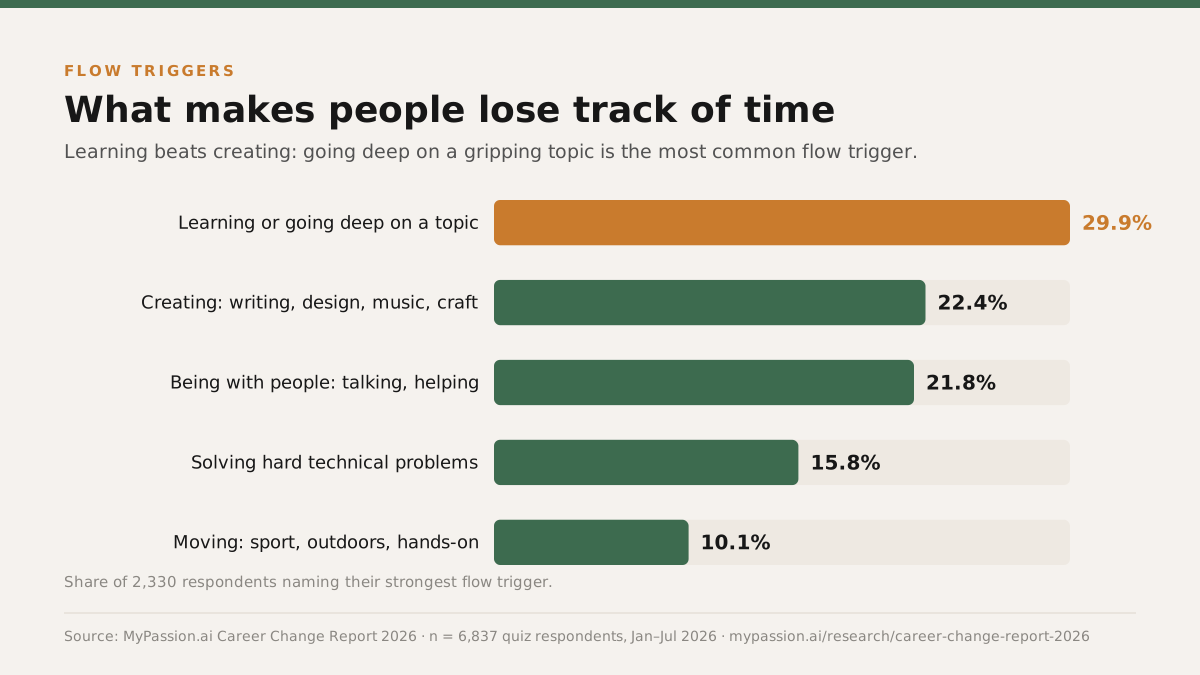
Split it by education and the preference sharpens with every degree. Learning is named by 27.3% of high-school respondents and 36.1% of master's respondents, the highest of any group, while being with people falls from 25.8% to 15.6% across the same range.
| Learning or going deep on a topic | Creating: writing, design, music, craft | Being with people | Solving hard technical problems | Moving: sport, outdoors, hands-on | Base n | |
|---|---|---|---|---|---|---|
| High school | 27.3% | 22.5% | 25.8% | 13.9% | 10.5% | 970 |
| Vocational or certifications | 28.4% | 24.5% | 19.1% | 18.1% | 9.8% | 204 |
| Self-taught or bootcamp | n/a | n/a | n/a | n/a | n/a | 84 |
| Bachelor's degree | 31.7% | 21.9% | 20.2% | 16.7% | 9.5% | 707 |
| Master's degree or higher | 36.1% | 19.2% | 15.6% | 18.1% | 11.1% | 360 |
Source: MyPassion.ai Career Change Report 2026 (n = 2,325 respondents), dataset frozen 28 July 2026
Put the findings together and the paradox loosens. The people most likely to be stuck or bored are the ones who spent the longest in an environment built around learning, and they are also the ones most likely to name learning as the thing that absorbs them. The plainest reading available here is that roles which stop teaching people anything are the ones that lose them, and that the more someone has been trained to expect that feeling, the more its absence registers.
Advanced training rewards a style most people do not have
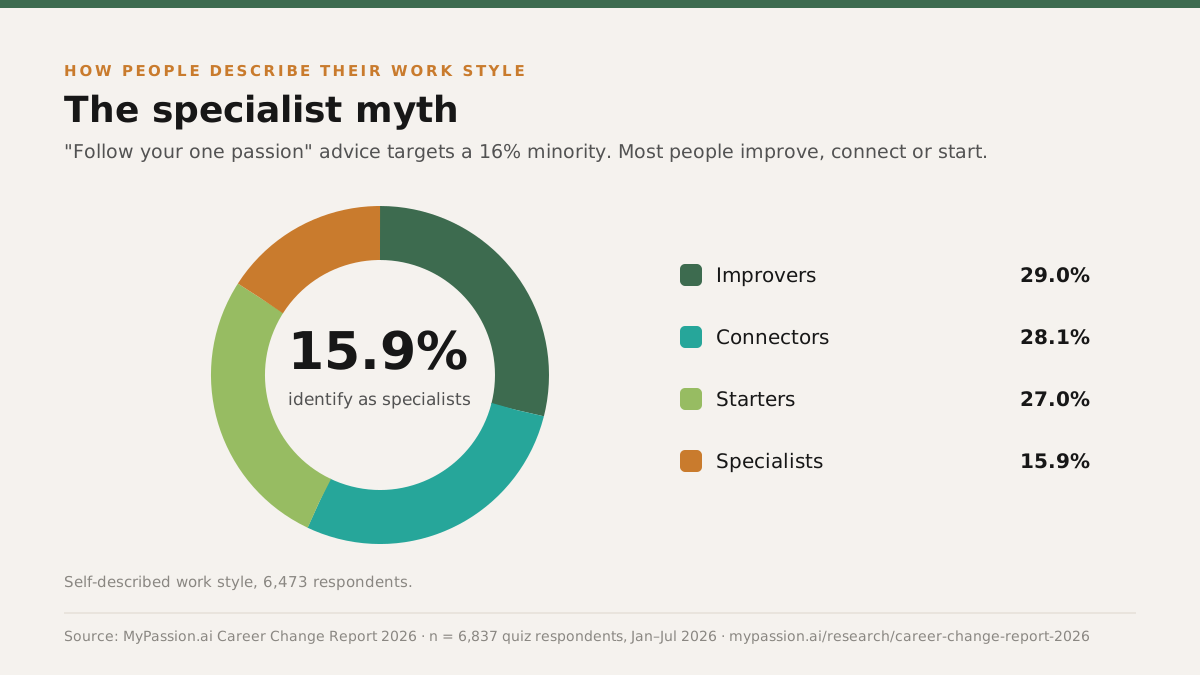
Asked how they prefer to work, 6,473 respondents split four ways: 29.0% describe themselves as improvers of what already exists, 28.1% as connectors of ideas or people, 27.0% as starters of new projects, and 15.9% as deep-focus masters of one subject.
This sits awkwardly next to how advanced education works. A master's degree is training in going deep on one subject, and it is the group most likely to report being stuck or bored. The single-subject work style that such training rewards is the minority preference everywhere, and it is scarcest among the most educated: 13.1% at master's level against 17.1% at high school. Advice built on finding your one thing is addressing a shrinking minority.
Among 1,058 respondents who say they have too many interests to commit to one, 27.2% have eight or more years of experience. The standard assumption is that breadth is a young person's condition that resolves once a career takes hold. More than a quarter of this group are deep into their working lives and still describe themselves the same way.
How this data was collected and what it can claim
All figures come from the frozen Career Change Report 2026 dataset: 6,837 anonymized responses collected between January 29 and July 28, 2026. Education and core struggle are separate fixed-choice questions, so the gradient is computed only on respondents who answered both in their current form. That gives 3,651 respondents across all five education routes, and 3,199 across the three formal-degree levels.
This is a self-selected sample of people actively questioning their career, not a representative population panel. It cannot tell you what share of graduates generally are bored at work, because contented people do not take a career quiz. What it compares is the shape of dissatisfaction between education levels among people who are all dissatisfied.
It is observational and establishes association, not cause. The controlled split in Table 3 is a stratified comparison, not a regression: it holds career stage roughly constant and controls nothing else. Age, country, industry and income are not in the published dataset and cannot be adjusted for.
Any cross-tab row with a base under 100 is suppressed and prints "n/a" rather than a percentage, which is why the self-taught row is absent from Table 6. The full sampling frame, exclusion rules and limitations are on the what this data can and cannot support, and the response-level aggregate tables behind every figure, and custom cuts of them, go to journalists and researchers on request: email the research team.
How to cite this page
Everything here is free to reuse under CC BY 4.0 with a link back. Charts, tables and the response-level dataset included.
MyPassion.AI (2026). The Education Paradox. Career Change Report 2026. Retrieved from https://mypassion.ai/research/education-and-career-boredom
More from the Career Change Report 2026
Every page below cuts the same 6,837 responses a different way. Same dataset, same methodology, different question.
Also in this series: career change statistics 2026, job satisfaction statistics 2026, job hopping statistics 2026. The sampling frame, exclusions and suppression rules are in the research methodology, and the full index sits on the research hub. On the blog, career change at 30 is where this gradient usually starts to bite.
Questions about this finding
A degree answers what you are able to do. It was never built to answer what you should want.
Take the free career quiz
Research and analysis by Marco Kohns, founder of MyPassion.AI.
Published growth researcher (Journal of Business Research, Q1), MSc NOVA IMS Lisbon, and lecturer on AI for business at Católica Lisbon School of Business and Economics. Previously a growth product manager at a Silicon Valley scale-up operating in 100+ countries.
Disclosure: MyPassion.AI operates the career quiz that produced this data and sells a paid career report. Every figure states its base, the method is published in full, and we run custom cuts of the aggregate data for journalists and researchers on request.