
Career Change Statistics 2026
Twelve career change statistics you will not find anywhere else, because they come from our own data: 6,837 responses to the MyPassion.ai career quiz between January and July 2026, across 156 countries. Full methodology and charts live in the Career Change Report 2026.
Every statistic states its base. All of it is free to cite under CC BY 4.0 with a link to this page or the report.
- 01
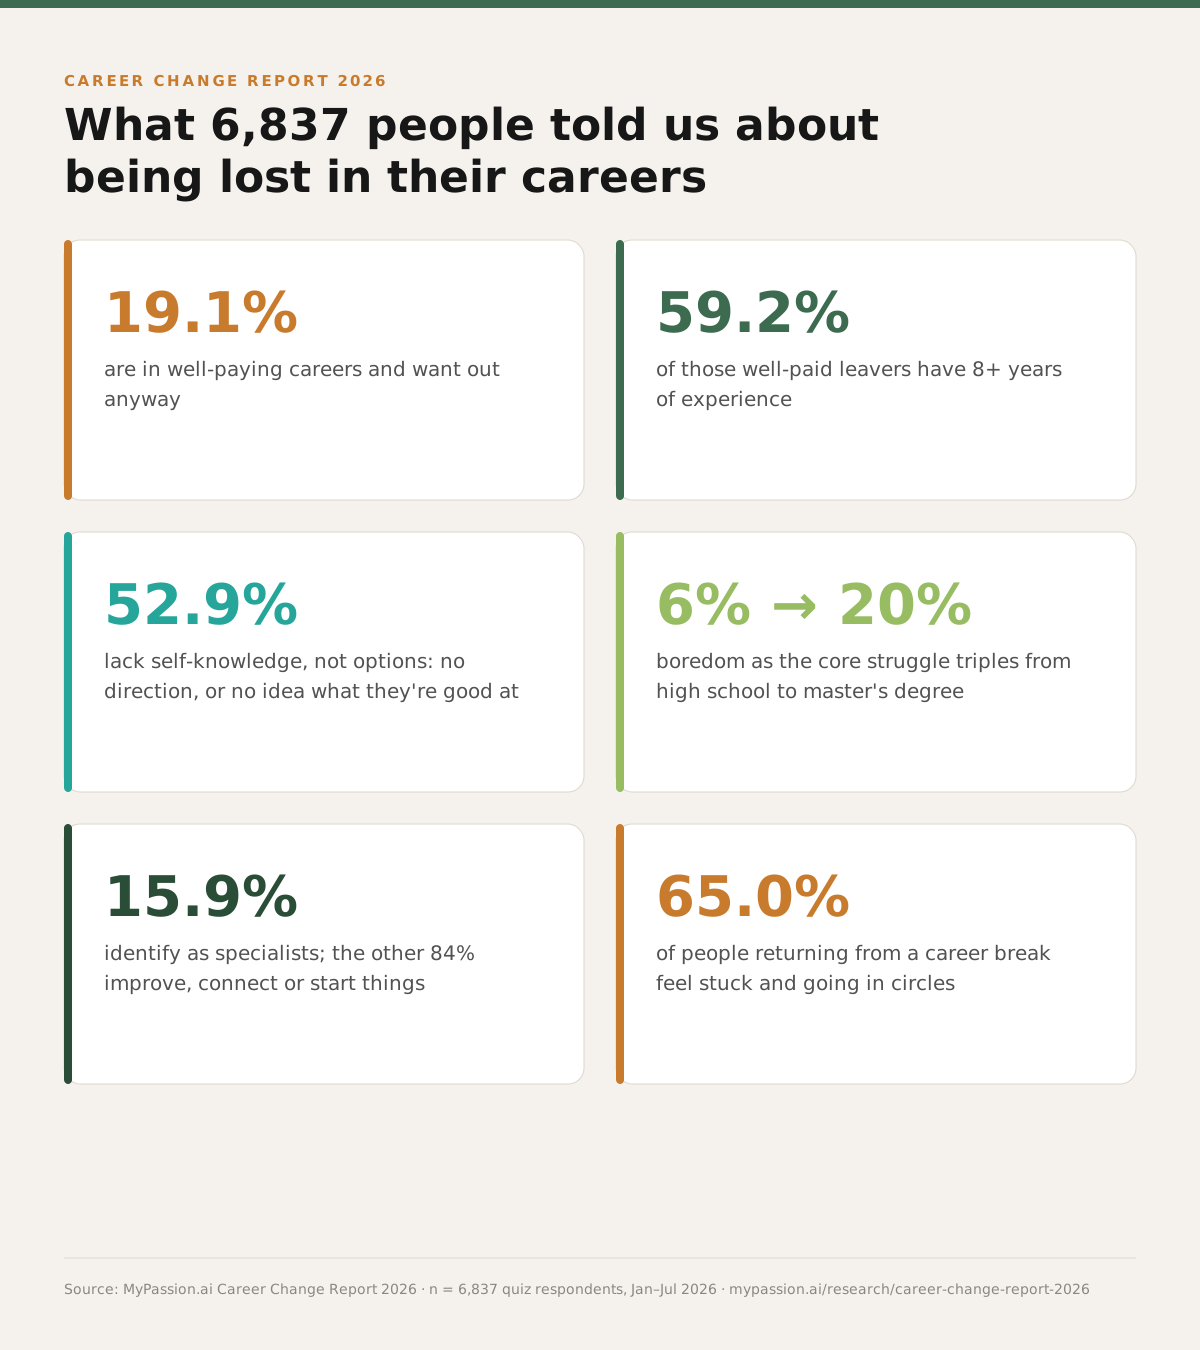
19.1% of people questioning their career are in jobs that pay well
Nearly one in five respondents describes their situation as being in a well-paying career while seeking change. They outnumber the stuck-or-unemployed group (16.6%).
n = 6,515 respondents describing their life situation
- 02
59.2% of well-paid career changers have 8+ years of experience
Within the well-paid group seeking change, 80.6% have at least four years in the workforce. Career doubt peaks at seniority, not in the first job.
n = 1,035 well-paid respondents seeking change
- 03
23.3% of all career-direction seekers have 8+ years in the workforce
Career questioning is not a graduate phase. Nearly a quarter of respondents with experience data are workforce veterans, and another 3.6% are returning from a career break.
n = 5,645 respondents with experience data
- 04
52.9% say their problem is self-knowledge, not a lack of options
26.5% have no idea which direction to pick and 26.4% cannot tell what they are good at. Only 20.5% report the opposite problem of too many interests.
n = 3,656 respondents naming their core struggle
- 05
43.4% of career-direction seekers hold a bachelor's degree or higher
14.9% hold a master's degree or higher. A degree reliably signals employability, not direction.
n = 5,653 respondents reporting education
- 06
Boredom as the core career struggle triples with education: 6.4% to 20.1%
The share naming boredom rises with every degree: 6.4% of high-school respondents, 14.9% of bachelor's graduates, 20.1% at master's level or higher.
bases: 1,553 high school, 1,078 bachelor's, 568 master's+
- 07
Only 15.9% of people identify as single-subject specialists
29.0% describe themselves as improvers, 28.1% as connectors, 27.0% as starters. Advice built on finding one passion addresses a minority of working styles.
n = 6,473 respondents describing their work style
- 08
27.2% of multi-passionate people have 8+ years of experience
Having too many interests to pick one is not a phase that graduates out. More than a quarter of this group are deep into their working lives.
n = 1,058 multi-interest respondents with experience data
- 09
65.0% of career-break returners feel stuck and going in circles
People returning after a break are the group most likely to describe their situation as stuck or unemployed, by a wide margin.
n = 203 respondents returning after a career break
- 10
29.9% name learning as their strongest flow trigger, ahead of creating
Going deep on a gripping topic beats creating (22.4%), being with people (21.8%), technical problem-solving (15.8%), and physical activity (10.1%).
n = 2,330 respondents naming a flow trigger
- 11
People from 156 countries searched for career direction in six months
The United States accounts for 32.7% of respondents, India 12.9%, the United Kingdom 7.2%. Two-thirds of responses come from outside the US.
n = 6,389 respondents reporting a country
- 12
75.4% who start the career quiz finish it, in a median of 6.9 minutes
When the question matters personally, completion behavior looks nothing like typical survey abandonment.
n = 6,860 started quiz sessions, Jan 29 to Jul 28, 2026
Every published number, with its base
The whole research section indexed in one place. Each row states the figure, the base it sits on, and the page carrying the analysis behind it. If you need a number for a deadline, take it from here and follow the link for the context.
| Figure | Value | Base n | Published on |
|---|---|---|---|
| Paid well and seeking change | 19.1% | 6,515 | Career Change Report 2026 |
| Of those, 8 or more years of experience | 59.2% | 1,035 | The Golden Handcuffs Index |
| Of those, naming stuck or bored | 26.2% | 714 | The Golden Handcuffs Index |
| Naming no idea which direction to pick | 26.5% | 3,656 | Career Change Report 2026 |
| Naming cannot tell what they are good at | 26.4% | 3,656 | Career Change Report 2026 |
| Naming stuck or bored, all respondents | 11.6% | 3,656 | Burnout Statistics |
| Naming stuck or bored, high school | 6.4% | 1,553 | The Education Paradox |
| Naming stuck or bored, master's or higher | 20.1% | 568 | The Education Paradox |
| Naming stuck or bored, 8 or more years in | 22.6% | 962 | Job Hopping Statistics |
| Identifying as single-subject specialists | 15.9% | 6,473 | Career Change Report 2026 |
| Naming learning as their strongest flow trigger | 29.9% | 2,330 | Career Change Report 2026 |
| Multi-interest respondents naming too many interests | 39% | 690 | Career Change Report 2026 |
| Career-break returners describing themselves as stuck | 65% | 203 | Job Hopping Statistics |
Source: MyPassion.ai Career Change Report 2026 (n = 6,837 respondents), dataset frozen 28 July 2026
The numbers as visuals, free to embed
Every chart below, and eight more in the full report, is published under CC BY 4.0. Copy the embed code and it credits this research automatically.
| Answer | Share |
|---|---|
| Student or graduate, no clear direction | 45.6% |
| In a well-paying career, seeking change | 19.1% |
| Too many interests, can't pick one | 18.7% |
| Stuck or unemployed, going in circles | 16.6% |

| Answer | Share |
|---|---|
| No idea which direction to pick | 26.5% |
| Can't tell what they're good at | 26.4% |
| Too many interests to commit to one | 20.5% |
| Nothing they try feels like a passion | 15.1% |
| Stuck or bored in current work | 11.6% |

| Answer | Share |
|---|---|
| Improving what already exists | 29% |
| Connecting ideas or people | 28.1% |
| Starting new projects | 27% |
| Mastering one subject | 15.9% |

| Answer | Share |
|---|---|
| Learning or going deep on a topic | 29.9% |
| Creating: writing, design, music, craft | 22.4% |
| Being with people | 21.8% |
| Solving hard technical problems | 15.8% |
| Moving: sport, outdoors, hands-on | 10.1% |

Where to go deeper
The full report carries the eight original charts and the full findings. The how this research is made sets out the sampling frame, the exclusion rules, the suppression threshold, and a plain statement of what this data cannot show. Read that one before citing any figure here.
For economy-wide labor statistics that complement this self-selected sample, the primary sources are the U.S. Bureau of Labor Statistics JOLTS program for quits and separations, the BLS employee tenure release, and Pew Research Center's economy and work studies. They measure the whole workforce; this page measures the people inside the career-change question. The two lenses answer different questions.
How to cite this page
Everything here is free to reuse under CC BY 4.0 with a link back. Charts, tables and the response-level dataset included.
MyPassion.AI (2026). Career Change Statistics 2026. Career Change Report 2026. Retrieved from https://mypassion.ai/research/career-change-statistics
More from the Career Change Report 2026
Every page below cuts the same 6,837 responses a different way. Same dataset, same methodology, different question.
Also in this series: the education paradox, job satisfaction statistics 2026, burnout statistics 2026. The sampling frame, exclusions and suppression rules are in the research methodology, and the full index sits on the research hub. On the blog, career change at 30 and the multi-career generation read these numbers as decisions, and am I underpaid? checks the pay half of them against BLS wage data.
Statistics describe the crowd. The quiz behind them takes about seven minutes and describes you.
Take the free career quiz
Research and analysis by Marco Kohns, founder of MyPassion.AI.
Published growth researcher (Journal of Business Research, Q1), MSc NOVA IMS Lisbon, and lecturer on AI for business at Católica Lisbon School of Business and Economics. Previously a growth product manager at a Silicon Valley scale-up operating in 100+ countries.
Disclosure: MyPassion.AI operates the career quiz that produced this data and sells a paid career report. Every figure states its base, the method is published in full, and we run custom cuts of the aggregate data for journalists and researchers on request.