
Job Hopping Statistics 2026
The most quoted number in careers journalism is 12.7, and most articles quoting it have it wrong. It counts jobs, not careers, for one American birth cohort, between two specific ages.
This page states what the figure measures, explains why no lifetime career-change statistic exists at all, and then uses first-party data to describe what actually changes across a working life. The answer is not what a build-your-expertise narrative predicts.
BLS figures are public domain and cited to the BLS. First-party figures state their base, are free to cite under CC BY 4.0, and reproduce from the published dataset.
The numbers worth carrying
Each line names its source and its base, written to be quoted as it stands.
- 0112.7 jobs held on average between ages 18 and 56 by Americans born 1957 to 1964 (BLS National Longitudinal Survey of Youth 1979). Jobs, not careers.
- 020 official statistics exist for lifetime career changes. No major agency defines or tracks a career change the way it tracks employer changes.
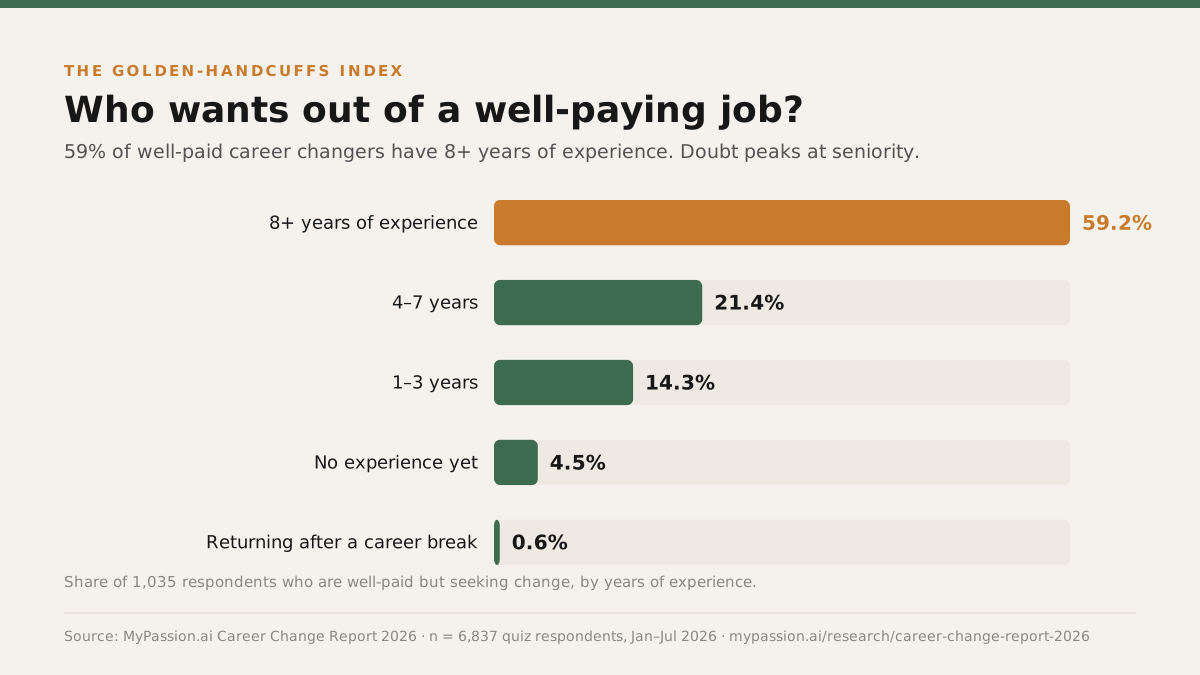
- 0359.2% of well-paid people seeking a change have 8 or more years of experience, and 80.6% have at least four. Tenure is a weak proxy for satisfaction (n = 1,035).
- 0446.6% of respondents with 8 or more years of experience are in the well-paid, seeking-change segment, against 1.7% of those with no experience yet (n = 1,316 and 2,791).
- 0517.4% to 12.9% is how the share describing themselves as single-subject specialists moves across a career. The appetite to specialise falls with tenure rather than rising.
- 065.3% to 22.6% is how the share naming being stuck or bored moves across the same span. What accumulates with tenure is disengagement, not focus.
- 0727.2% of people who say they have too many interests to pick one have 8 or more years of experience. Breadth does not resolve with tenure (n = 1,058).
12.7 counts jobs, not careers
The figure comes from the BLS National Longitudinal Survey of Youth 1979. Americans born between 1957 and 1964 held an average of 12.7 jobs between ages 18 and 56. A job in that survey means a separate employer or position. Nothing in it counts fields, industries, or occupations.
Three details that go missing in transit
One person can hold a dozen jobs inside a single career without ever changing direction. Another can change career once while holding three jobs. The statistic cannot tell them apart.
There is no lifetime career-change statistic
Journalists reach for 12.7 as a career-change number because no career-change number exists. No major statistical agency defines a career change, so none of them counts one. What the agencies do publish measures adjacent things, and the distinctions matter more than the values.
| Source | Unit of measurement | What it cannot tell you |
|---|---|---|
| BLS NLSY79 | Cumulative count of jobs held by one birth cohort between ages 18 and 56 | Anything about fields or occupations, anything about people born after 1964, and anything beyond age 56 |
| BLS employee tenure | Median years workers have been with their current employer | Whether long tenure reflects satisfaction or a lack of alternatives; it moves with hiring conditions and workforce age |
| BLS JOLTS | Monthly quits, hires and separations across establishments | Where anyone went, or why. A quit into the same field and a quit into a new one are the same event here |
Compiled by MyPassion.AI. All three series are public domain U.S. government data and should be cited to the BLS directly.
Long tenure is a weak signal of satisfaction
If staying put indicated contentment, the people questioning their careers would skew junior. They do not. Among 1,035 well-paid respondents seeking change, 59.2% have eight or more years of experience and 80.6% have at least four. Across all 5,645 respondents with experience data, 23.3% have eight or more years behind them.
| Segment | Share | Base n |
|---|---|---|
| No experience yet | 49.4% | 2,791 of 5,645 |
| 1-3 years | 12.8% | 725 of 5,645 |
| 4-7 years | 10.8% | 610 of 5,645 |
| 8+ years | 23.3% | 1,316 of 5,645 |
| Returning after a career break | 3.6% | 203 of 5,645 |
Source: MyPassion.ai Career Change Report 2026 (n = 5,645 respondents), dataset frozen 28 July 2026
Read the other way round it is starker. Of respondents with eight or more years, 46.6% are in the well-paid seeking-change segment, against 1.7% of those with no experience yet. Tenure does not resolve career doubt in this sample. It concentrates a particular kind of it.
| Student or graduate, no clear direction | Too many interests, can't pick one | In a well-paying career, seeking change | Stuck or unemployed, going in circles | Base n | |
|---|---|---|---|---|---|
| No experience yet | 75.8% | 16.6% | 1.7% | 6% | 2,791 |
| 1-3 years | 37.2% | 18.2% | 20.4% | 24.1% | 725 |
| 4-7 years | 17.7% | 21.3% | 36.2% | 24.8% | 610 |
| 8+ years | 4.6% | 21.9% | 46.6% | 26.9% | 1,316 |
| Returning after a career break | 9.4% | 22.7% | n/a | 65% | 203 |
Source: MyPassion.ai Career Change Report 2026 (n = 5,645 respondents), dataset frozen 28 July 2026
What accumulates is disengagement, not focus
The standard account of a career is narrowing: you try things, you find your thing, you go deep. Our data describes the opposite motion. The share of respondents describing themselves as single-subject specialists falls from 17.4% among people with no experience yet to 12.9% among those with eight or more years, reaching its lowest point at four to seven years (11.8%). Over the same span, the share describing themselves as improving what already exists rises from 27.4% to 34.4%.
| Improving what already exists | Connecting ideas or people | Starting new projects | Mastering one subject | Base n | |
|---|---|---|---|---|---|
| No experience yet | 27.4% | 28% | 27.3% | 17.4% | 2,782 |
| 1-3 years | 28.5% | 26.9% | 28.2% | 16.4% | 720 |
| 4-7 years | 29.3% | 32.3% | 26.7% | 11.8% | 604 |
| 8+ years | 34.4% | 28.2% | 24.5% | 12.9% | 1,315 |
| Returning after a career break | 36.5% | 26.6% | 23.2% | 13.8% | 203 |
Source: MyPassion.ai Career Change Report 2026 (n = 5,624 respondents), dataset frozen 28 July 2026
What does accumulate is disengagement. The share naming being stuck or bored as their core struggle climbs from 5.3% among people with no experience yet to 12.5% at one to three years, 12.8% at four to seven, and 22.6% at eight or more. Every other struggle moves the other way or stays flat.
| No idea which direction to pick | Can't tell what they're good at | Too many interests to commit to one | Nothing they try feels like a passion | Stuck or bored in current work | Base n | |
|---|---|---|---|---|---|---|
| No experience yet | 29.7% | 29.2% | 22.4% | 13.5% | 5.3% | 1,713 |
| 1-3 years | 25% | 27.7% | 19.1% | 15.7% | 12.5% | 440 |
| 4-7 years | 23.5% | 24.8% | 22.3% | 16.6% | 12.8% | 391 |
| 8+ years | 22.3% | 21.2% | 18% | 15.9% | 22.6% | 962 |
| Returning after a career break | 29.4% | 28% | 14% | 21% | 7.7% | 143 |
Source: MyPassion.ai Career Change Report 2026 (n = 3,649 respondents), dataset frozen 28 July 2026
A career does not converge on one subject. It converges on improving something that already exists, and on being bored by it.
A career break does not carry the pattern
One row breaks every trend above. People returning after a career break look nothing like their tenure would predict. 65.0% describe themselves as stuck or unemployed and going in circles, more than double any other experience band. Their disengagement rate falls back to 7.7%, near the entry-level figure, and what replaces it is directionlessness: 29.4% cannot name a direction and 28.0% cannot name a strength, the highest combined self-knowledge gap in the table.
The plainest reading is that a break resets the problem to an earlier and harder one. Boredom requires a job to be bored in. What returning workers describe instead is not knowing what to aim at, which is the problem of someone starting over rather than someone stalling.
| Learning or going deep on a topic | Creating: writing, design, music, craft | Being with people | Solving hard technical problems | Moving: sport, outdoors, hands-on | Base n | |
|---|---|---|---|---|---|---|
| No experience yet | 27.1% | 22.7% | 24.8% | 14.8% | 10.6% | 1,064 |
| 1-3 years | 32.3% | 21.5% | 22.2% | 12.5% | 11.5% | 288 |
| 4-7 years | 30.9% | 19.9% | 21.3% | 21.3% | 6.6% | 272 |
| 8+ years | 33.1% | 22.9% | 17% | 17.1% | 9.9% | 607 |
| Returning after a career break | n/a | n/a | n/a | n/a | n/a | 92 |
Source: MyPassion.ai Career Change Report 2026 (n = 2,323 respondents), dataset frozen 28 July 2026
Three rules for this statistic
Say jobs when the source says jobs. If your sentence needs the word career, 12.7 is not the number for it, and no number is. Write around the gap rather than borrowing a figure that does not measure what you are describing.
Carry the cohort and the age range. "An average of 12.7 jobs between ages 18 and 56, among Americans born from 1957 to 1964" is barely longer than the wrong version and is defensible. Dropping the qualifiers is what turns a good statistic into a bad one.
Do not infer satisfaction from tenure. Long tenure and wanting out coexist comfortably: 59.2% of the people in our data who are paid well and want out have eight or more years in. A falling quits rate is evidence about the labour market before it is evidence about how anyone feels.
What each figure here can and cannot claim
BLS figures on this page are public domain U.S. government data, cited to their original releases and not restated or recomputed. Where a widely circulated variant of the 12.7 figure could not be traced to a BLS release, it is named as unsupported rather than repeated.
Every first-party figure comes from the frozen Career Change Report 2026 dataset: 6,837 anonymized responses collected between January 29 and July 28, 2026. Experience is self-reported in five bands rather than as a count of years, so nothing here produces a job count or a career count of our own, and none of it is comparable to the BLS series.
This is a self-selected sample of people actively questioning their career, not a representative population panel. Differences between experience bands describe the shape of career doubt at each stage, not how common it is. It is cross-sectional: nobody was followed over time, so any language about what happens across a career describes differences between groups, not change within individuals.
Bases vary by field and are printed with every figure. Any cross-tab row under 100 respondents is suppressed. The full sampling frame, exclusion rules and limitations are on the how this research is made, and the aggregate tables behind every figure, and custom cuts of them, go to journalists and researchers on request: email the research team.
How to cite this page
Everything here is free to reuse under CC BY 4.0 with a link back. Charts, tables and the response-level dataset included.
MyPassion.AI (2026). Job Hopping Statistics 2026. Career Change Report 2026. Retrieved from https://mypassion.ai/research/job-hopping-statistics
More from the Career Change Report 2026
Every page below cuts the same 6,837 responses a different way. Same dataset, same methodology, different question.
Also in this series: career change statistics 2026, the education paradox, burnout statistics 2026. The sampling frame, exclusions and suppression rules are in the research methodology, and the full index sits on the research hub. On the blog, is it too late to change careers works the same BLS series into a decision rather than a count.
Questions about job hopping data
Counting jobs is easy, so we count jobs. The number people actually want has never been measured.
Take the free career quiz
Research and analysis by Marco Kohns, founder of MyPassion.AI.
Published growth researcher (Journal of Business Research, Q1), MSc NOVA IMS Lisbon, and lecturer on AI for business at Católica Lisbon School of Business and Economics. Previously a growth product manager at a Silicon Valley scale-up operating in 100+ countries.
Disclosure: MyPassion.AI operates the career quiz that produced this data and sells a paid career report. Every figure states its base, the method is published in full, and we run custom cuts of the aggregate data for journalists and researchers on request.